EUR/GBP Elliott Wave analysis – Where can sellers enter again?

EUR/GBP has been one of the most fascinating currency pairs in the forex market for years. After a minor bounce in July, the pair broke lower again and is now approaching the March 2022 lows. Consequently, we expect the downside to continue for several weeks toward our projected targets. So, when and where should traders look for opportunities?
Between July 2015 and March 2020, the pair completed a 5-wave bullish cycle. According to Elliott Wave Theory, a 3-wave correction typically follows a 5-wave trend. This is precisely what unfolded. Since March 2020, the pair has experienced multiple sell-offs to correct the nearly 5-year trend. We identified this corrective phase as a double zigzag structure, a 7-swing pattern. The first leg (wave W) ended in March 2022 but remains incomplete. Wave X, acting as the connector, followed and ended in September 2022. Since then, we have been counting wave Y, which began in September 2022.
EUR/GBP daily chart – 12.21.2024 weekend update
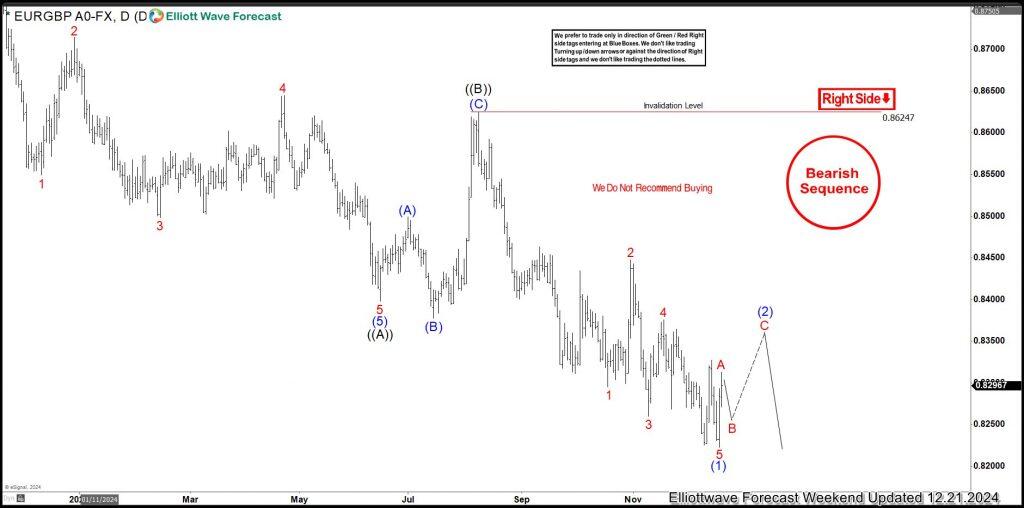
EUR/GBP, daily
Price has completed waves ((A)) and ((B)) of Y and is now in wave ((C)) of Y, as the chart above shows. Within wave ((C)), it appears that wave (1) has finished, and price is now correcting the 5-wave diagonal structure from August 2024 in wave (2). Wave (2) remains incomplete, as price is still within wave B of (2). If the current bounce develops into a 3- or 7-swing structure (zigzag or double zigzag), we aim to sell at the end of wave (2). We expect wave (2) to end below 0.8624, after which the price should continue lower toward the extreme zone of wave Y.
EUR/GBP one-hour chart – 12.21.2024 weekend update
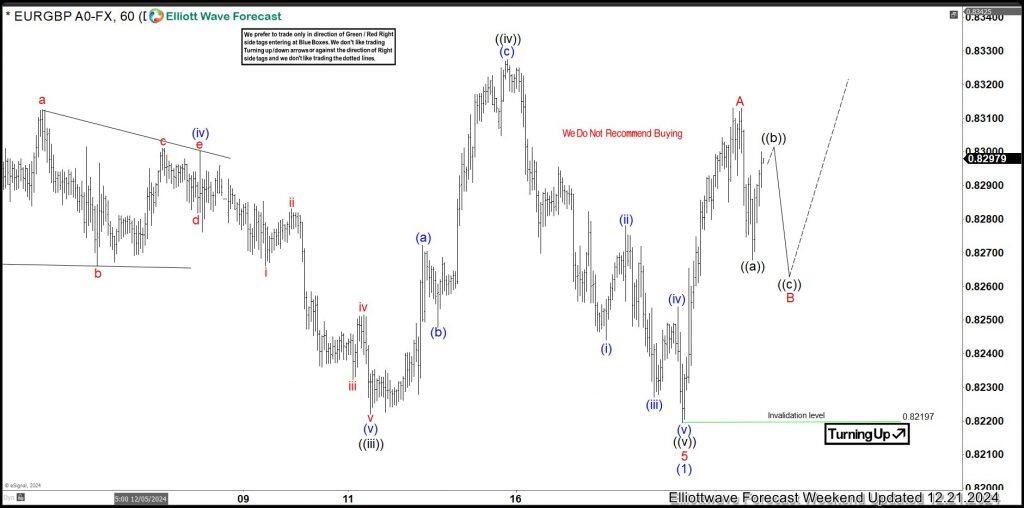
EUR/GBP, H1
The H1 chart highlights the development of wave (2). Wave A of (2) ended with a 5-wave impulse structure. Price is currently recovering from the wave ((a)) pullback, identified as wave ((b)). One more leg lower for wave ((c)) above 0.8219 may occur before the price turns upward for wave C. Once wave B is confirmed, we can project where wave C might finish and plan to sell from the blue box.
However, it’s possible that price may not drop for wave ((c)) as expected. In that scenario, the last pullback for wave ((a)) could be identified as the end of wave B or even wave ((ii)) of A. Wave A might extend beyond current recognition before wave B follows.
Author

Elliott Wave Forecast Team
ElliottWave-Forecast.com


