EUR/CHF has stopped going down at month end

Biased
As a frequent consumer of academic research, I am more and more intrigued by the replication crisis and the inherent bias in all academic research. As a professor or PhD or whatever, you want to get published and the way to get published is not to find boring results that reflect common knowledge. For example, if you conduct a study investigating whether purple jellybeanscause acne, and you get a result that says “no”, you won’t publish that because it’s boring. But imagine 30 scientists are doing this out in the world, using different colors of jellybeans. By pure randomness, one of those scientists will find a statistically significant result.
So, the one scientist finds green jellybeanscause acne, and publishes that study while the others look for other ideas to work on. Then USA Today publishes a big article about the perils of green jellybeans, quoting the peer-reviewed paper. This isn’t necessarily intentionally deceptive; it’s just a natural filter that occurs across all research domains: Interesting results get published and ho-hum ones do not. This is a problem because it casts doubt on all academic research.
Look at this plot of over 1.1 million z-values from medical research conducted between 1976 and 2019. And this is research that is peer reviewed and subjected to a higher standard than most social science research!
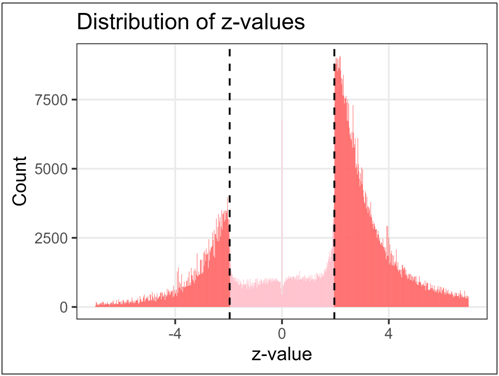
Whether this is misconduct or publication bias is kind of irrelevant. The massive overrepresentation of super interesting stuff in published research is the foundation of the replication crisis in academia.
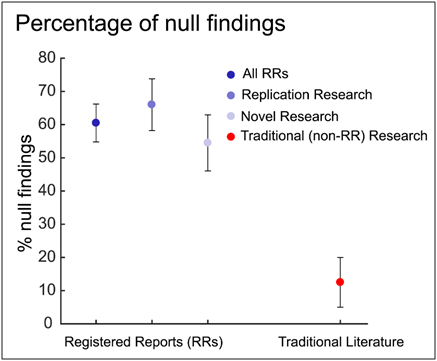
A primary solution to the replication crisis is to force researchers to register their reports before they find the results. That way, if the null hypothesis emerges (which it normally does), then this will be recorded.
In research, the null hypothesis is a statement that there is no effect or relationship between variables being studied; it serves as the baseline assumption that researchers aim to disprove through statistical analysis. The chart at right shows the percent of null hypothesis findings in reports that are pre-registered (RRs) vs. traditional literature (no pre-registration).
Pretty crazy stuff
XKCD covers the issue with humor, see for example the classic green jellybean comic and that lovely p-value comic panel at right. It’s funny because it’s true.
Anyhoo. The reason I bring this up is that as I learn more and more about this refusal to publish the null hypothesis, it makes me want to publish my null results more often. The risk is that these null results are less interesting and not actionable compared to significant results, but I aim to publish the null hypothesis at least when it’s of some interest or value to readers.
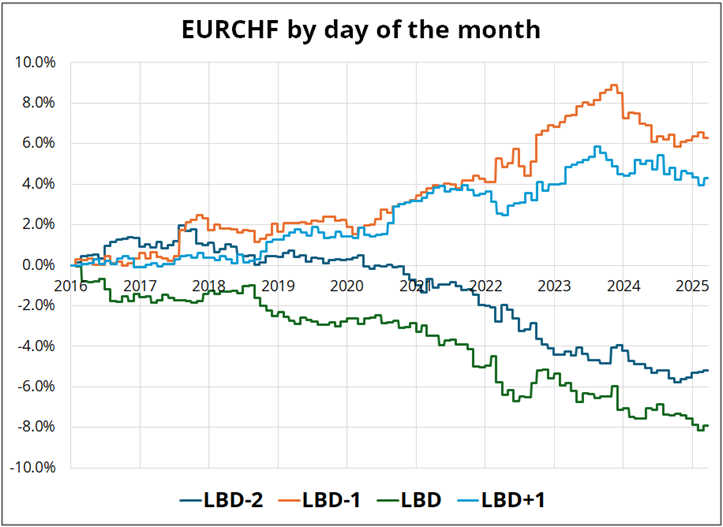
The topic I have been studying is the performance of EURCHF around month end. Historically, EURCHF tends to sell off on LBD-2 and LBD where LBD is the last business day of the month. This is related to persistent repatriation flows into CHF, many of which are executed at month end and particularly at the WMR fix. Interestingly, EURCHF also rallied on LBD-1 and LBD+1 due to mean reversion. The huge selling on LBD-2 and LBD created great opportunities over the years as you could trade both directions, short into WMR on the repatriation days and long thereafter.Note: LBD-2 is significant because spot value is month end on that day, so those that want their flows to be spot value LBD need to sell on LBD-2.
Here's the P&L of the four trades around month end. I used data from 2016 to now because you don’t want to look at the period when EURCHF was floored or when it collapsed and exploded after the SNB removed the CHF cap in 2015.
You can see that the flows are consistently LHS on LBD-2 and LBD and consistently RHS on the other two days. This is measuring 4pm London to 4pm London (not NY close to NY close) because the action happens at the WMR benchmark (4pm London).
Seems pretty interesting
If you bundle the four trades into one strategy where you are short EURCHF the two repatriation days and long the two rebound days, you get a P&L chart that looks like this:
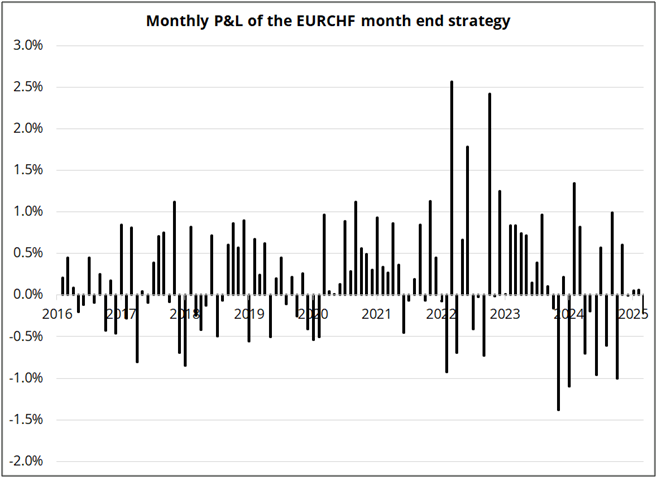
Lots of P&L and positive skew. This doesn’t account for transaction costs (TC), but you can trade for super cheap at the WMR so if you adjust for TC, it barely changes the result. OK, so far so good. But if you then chart the P&L of the strategy, you see something different:
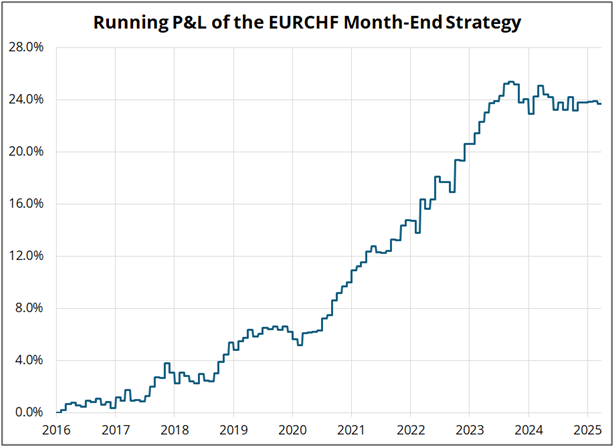
The trade stopped working in September 2023, which is when the SNB stopped intervening in EURCHF (buying CHF) and when the down trend in EURCHF started to make the choppy bottom still in force now. This might be a coincidence, but I doubt it. More likely, the persistent down trend in EURCHF from mid-2018 to now was the primary driver of the month end effect and if the downtrend is over, that could easily mean that month-end repatriation flow is drying up, too. Repatriation is not exclusively a month-end thing, so if it’s drying up at month-end, it’s probably drying up more broadly, too.
The takeaways are:
-
I was expecting to do a month-end EURCHF trade because I know the data broadly shows this is a good strategy. But seeing the P&L of the strategy peak right as SNB intervention ended and EURCHF bottomed makes me think that the month-end effect in EURCHF has expired.
-
Bigger picture this is probably bullish EURCHF. Less repatriation flow, no SNB selling EURCHF, and super low rates in Switzerland have changed the flow dynamic.
-
I might have just lost a few readers because you had to read all this and there is no money to be made by reading it.
GME
I have a ton of respect for the crazy moral hazard trade that Michael Saylor has engineered in bitcoin. He started when bitcoin was at $10k and despite buying billons of dollars’ worth of BTC above $100k, his average is $67k. Not too shabby. While there is now rightful concern about the Ponzi-like aspect of the most recent Strife offering, he’s already won, regardless of whether bitcoin goes up, down, sideways, or diagonal from here.
On the other hand, the copycats buying bitcoin for the first time at $88,000 in an attempt to boost money-bleeding operations when their stock is already trading at 2X book value smack more of desperation and a lack of creativity than mad genius, gunslinging,or Cyberhornet awesomeness. There was a reason MSTR captured the zeitgeist and earned a huge premium—they were the first mover, and they were offering a listed bitcoin proxy before there were spot ETFs. Now, MSTR maintains the afterglow of first mover status, but companies like MARA, RIOT, and GME don’t. Also, MSTR trades at 2X book value, so if GME spent all its cash on BTC and converged to the same valuation as MSTR, the stock would go down, not up. Sure, GME is a memestock, but it’s lost its zip over the years.
Author

Brent Donnelly
Spectra Markets
Brent Donnelly is the President of Spectra Markets. He has been trading currencies since 1995 and writing about macro since 2004. Brent is the author of “Alpha Trader” (2021) and “The Art of Currency Trading” (Wiley, 2019).


