Ethereum price analysis: Huge bullish potential for ETH above $405
- ETH/USD moving inside a compressing structure
- Levels to take into account are $395 on the upside and $302 on the downside

ETH/USD has developed since early May a technical structure that is compressing the price and has organized some interesting patterns. Every Ethereum attempt to break the topside of the triangle has developed a bearish big-size Doji candle, redirecting the price towards the base of the price structure.
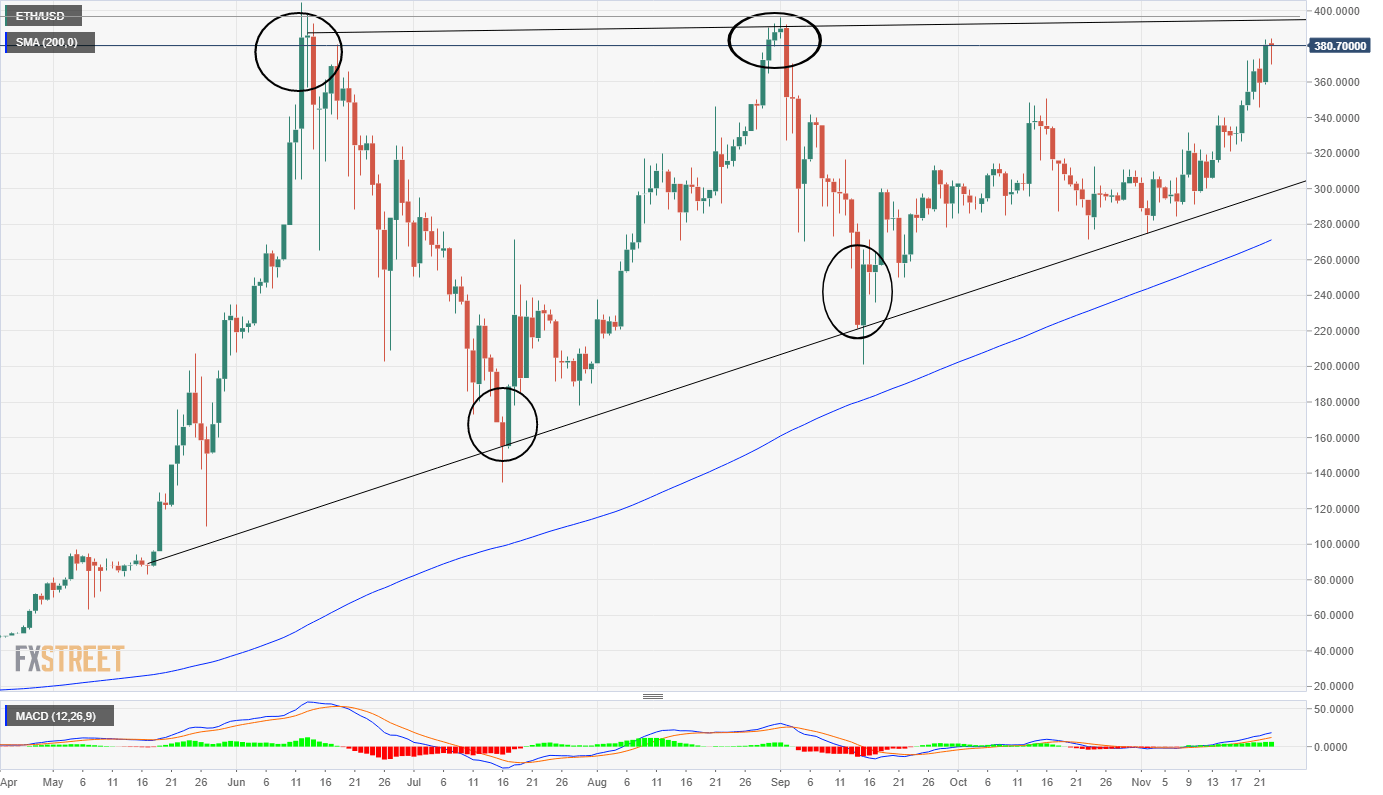
MACD is showing a significant width in-between lines, ensuring that a new cross with the resistance trendline is on the way, still with some room to advance. This resistance has already stopped strong bullish runs in the past, so it is likely that the upcoming test will be eventful, with every Ethereum trader focusing on those all-time high levels. Expect some profit-taking and some new bids there.
The bullish scenario shows $404.98 as the most meaningful resistance before a free ride to unexplored territory, which would trigger a huge bullish potential. If we look at a bigger timeframe, the weekly chart shows a wide open MACD aiming to the upside, so if $404.98 is broken, bullish potential is huge.
-636470245548962234.png)
On the bearish side, support is located at $302, in the trendline coming from early May. If broken, that would take Ethereum price straight to the $270 mark, where the 200-SMA is now standing.
Conclusion
Price action is going to dictate, as usual, upcoming moves for Ethereum, the second-biggest cryptocurrency by volume, but right now MACD strength is setting up a bullish scenario for the upcoming weeks. The current technical structure shall only be changed by extreme external shocks that could change the whole technical picture.
Author

Tomas Salles
FXStreet
Tomàs Sallés was born in Barcelona in 1972, he is a certified technical analyst after having completing specialized courses in Spain and Switzerland.


