Equities report: The USA’s ‘Liberation day’ is set to occur on the 2nd of April

US equity markets seem to have moved higher since last week’s report. In todays’ report we are to discuss the USA’s “Liberation Day” on the 2nd of April and the release of the US Core PCE rates on Friday. We are to conclude the report with a technical analysis of S&P 500’s daily chart for a rounder view.
The US Government and its “Liberation Day”
President Trump’s reciprocal tariffs are set to be implemented on the 2nd of April which is next Wednesday and has been touted as “Liberation Day”. The President is expected to announce widespread reciprocal tariffs on nations or blocs, with the tariffs potentially targeting industrial sectors such as automobiles, pharmaceuticals and semiconductors. However, last week President Trump appeared to have provided some leeway for his tariff implementations. In particular, Reuters reported that President Trump stated not all new tariffs would be announced on the 2nd of April and that he may give “a lot of countries” a break on tariffs. The President’s comments appear to be a shift from his ‘harsher’ tariff rhetoric, with some leeway for negotiations appearing prior to the 2nd of April deadline that has been touted as “Liberation Day”. In turn the apparent willingness by the administration to negotiate and ease the degree to which tariffs may be imposed appears to have aided the US Equities markets and thus should the US Government decide to gradually impose tariffs on a sector by sector and case by case basis, it could alleviate concerns about full-blown trade wars occurring. Therefore, such a scenario could aid the US stock market as concerns over widespread trade wars and their impact on the US economy may ease. However, should that not be the case, it may have the opposite effect which in turn could weigh on the US Equities markets as trade wars with between the US and its allies may raise significant concern over the resiliency of the US economy. Nonetheless, in our view the administration may be concerned about the impact on the US economy should a full trade war occur and thus their recent shift may imply a willingness to engage in trade deals, which could prevent a widespread imposition of tariffs which may aid the US Equities markets.
US PCE rates due out Friday
The US PCE rates for February are set to be released this Friday and could determine the direction of the US Equities markets. The US PCE rates are the Fed’s favourite tool for measuring inflationary pressures in the US economy and thus the financial release could significantly influence the Fed’s monetary policy direction in their upcoming meeting as to whether they should remain on hold, cut rates or the currently extreme scenario of hiking rates. Therefore, we tend to focus on the release of the Core PCE rates, which are expected by economists to come in at 2.7% on a year-on-year basis which would be higher than the prior rate of 2.6% implying an acceleration of inflationary pressures in the US economy. In turn, the impact of inflation accelerating or remaining ‘sticky’ may increase pressure on the Fed to maintain its restrictive monetary policy. Therefore, the implications of the Fed remaining on hold, could weigh on the US Equities markets as the financial conditions surrounding the US economy may remain restrictive. On the other hand, should the Core PCE rate come in lower than expected, thus implying easing inflationary pressures in the economy, it could in turn increase pressure of the Fed to resume on their rate-cutting cycle, which may aid the US Equities markets. Therefore, should the Core PCE rate come in as expected or higher it could weigh on US stock markets, whereas a lower-than-expected inflation print may have the opposite effect and may thus aid the US stock markets.
Technical analysis
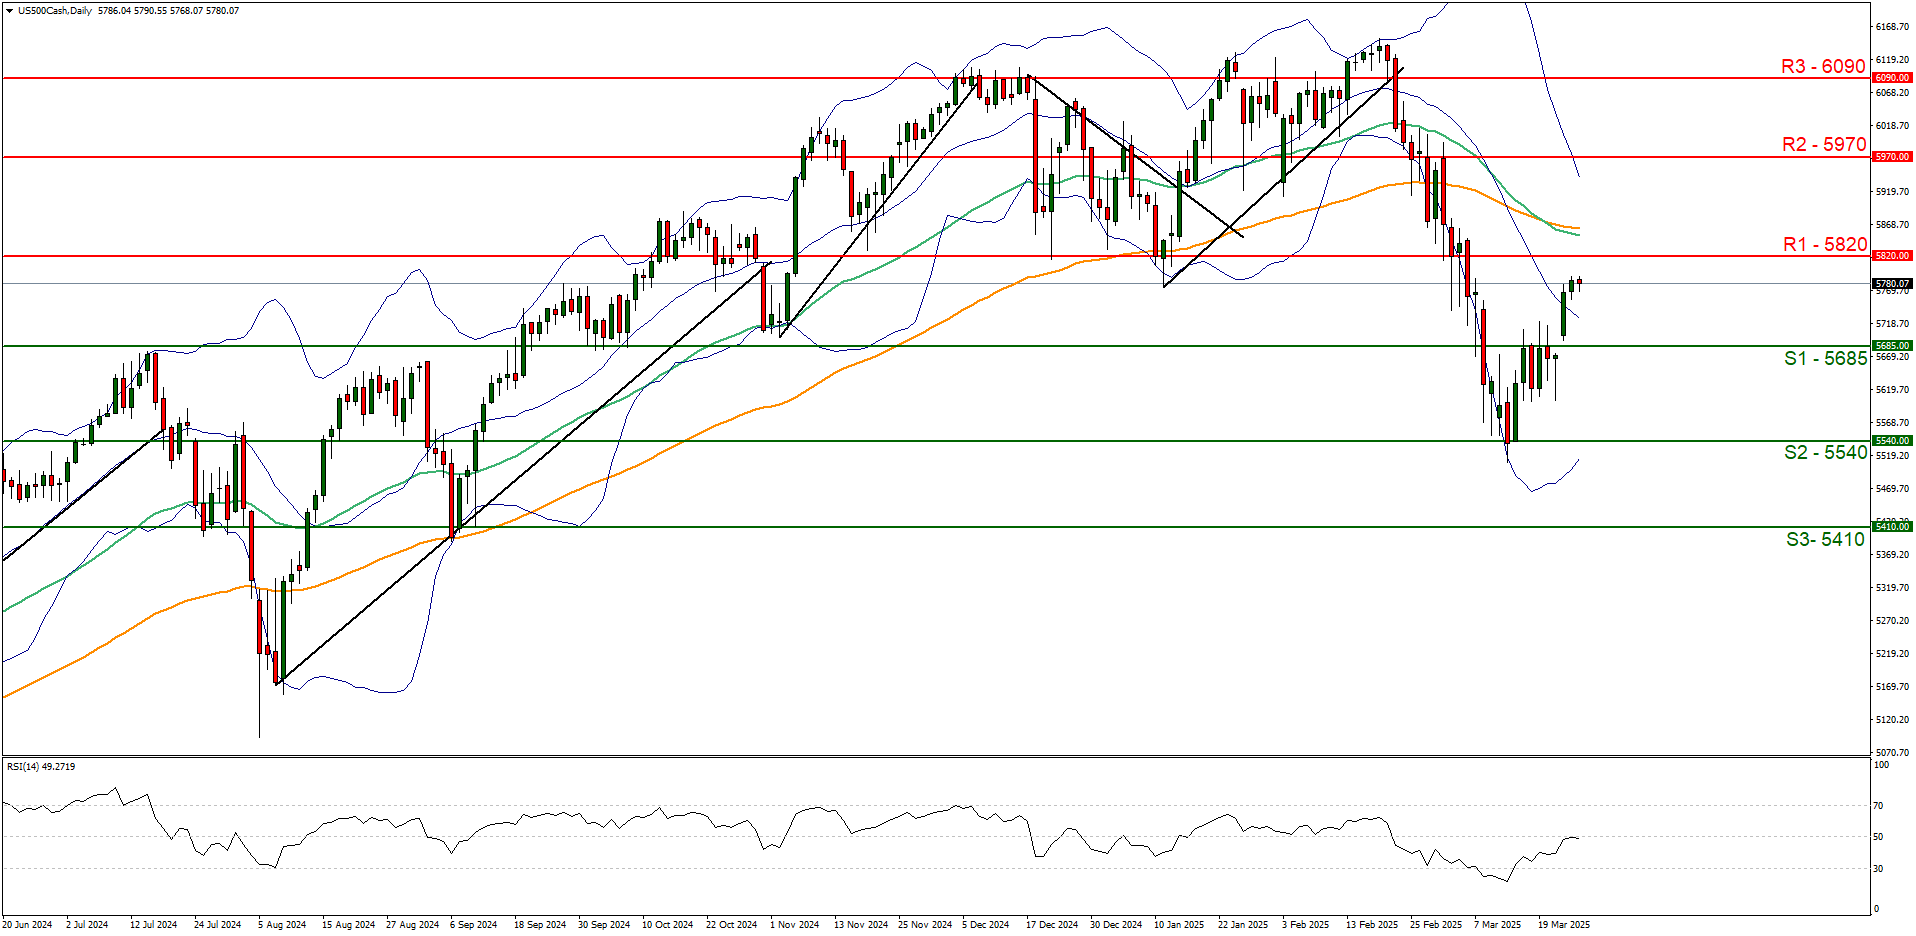
US500 daily chart
-
Support: 5685 (S1), 5540 (S2), 5410 (S3).
-
Resistance: 5820 (R1), 5970 (R2), 6090 (R3).
The S&P500 appears to be moving in sideways fashion after clearing our resistance now turned to support at the 5685 (S1) level. We would opt for a sideways bias for the index and supporting our case is the RSI indicator below our chart which currently registers a figure near 50, implying a neutral market sentiment. Yet we must note that the Bollinger bands still remain extremely wide, implying high market volatility and when looking at the RSI indicator’s ascent from the 30 to 50 figure currently, it could also imply that the bulls may be taking the reins. Nonetheless, for our sideways bias to be maintained we would require the index’s price to remain confined between the 5685 (S1) support level and the 5820 (R1) resistance line. On the flip side for a bullish outlook we would require a clear break above the 5820 (R1) resistance line with the next possible target for the bulls being the 5970 (R2) resistance level. Lastly, for a bearish outlook we would require a clear break below our 5685 (S1) support level with the next possible target for the bears being the 5540 (S2) support line.
Author

Phaedros Pantelides
Independent Analyst
Mr Pantelides has graduated from the University of Reading with a degree in BSc Business Economics, where he discovered his passion for trading and analyzing global geopolitics.


