Equities report: Liberation day today and US labour data for March on Friday

US equity markets are tantalised by Trump’s Liberation Day and today in the late American session, the US President is to announce the tariffs which are to be imposed on products entering the US. We also are to have a look at the US employment data for March which are to be released on Friday and the Fed’s stance, hence could also have an effect on US equities. Finally for a rounder view, we will be also providing a technical analysis of S&P 500’s one day chart.
Liberation Day tantalising US stock markets
President Trump’s “Liberation Day” is practically today as the US President is to announce the actual tariffs that will be applied on products entering the US from tomorrow onwards. More or less the uncertainty surrounding the actual tariffs that are to be applied as such is wide, given the blurry picture currently. But also the possible wider repercussions they may have on the US and the international economic outlook tends to make market participants more cautious thus possibly clipping the potential gains US equities markets could have. We also note that Fed policymakers are expecting the tariffs to have an inflationary effect in the US economy, which in turn may tie the bank’s hands in easing its monetary policy further. Such a scenario could also lessen the business opportunities and possibly profitability for US companies. Especially if one considers that the US tariffs are expected to provoke reciprocal tariffs on US products from the countries being targeted which would mean an intensification of the trade war on an international level. Hence the stakes are high and the uncertainty is high which may intensify the market reaction upon the announcement and the following days. Extensive and possibly high tariffs could weigh on US Equities, as uncertainty could peak, weighing on US equities. On the flip side, should the actual tariffs applied be lighter and possible at a narrower range of countries of origin than what the markets expect, could create a positive sentiment that the actual conditions are not as strict as the market may have anticipated thus creating some euphoria among market participants, supporting a more risk on approach and thus supporting US stock markets.
US employment report for March to be released
The Fed seems to maintain substantial doubts regarding further easing of its monetary policy. The Fed’s doubts may have been enhanced after the release of the PCE rates which at a core level, tended to imply a persistence of inflationary pressures in the US economy. With the PCE rates for February being out, the next big test for the Fed is expected to be the release of the US employment report for March on Friday. The Non-Farm payrolls figure, is expected to drop to 135k if compared to February’s 151k, the unemployment rate to remain unchanged at 4.1% and the average earnings growth rate to slow down marginally to 3.9%yy if compared to March’s 4.0%yy. Overall the data forecasted seem to imply further cooling of the US employment market and should the forecasts be realised, pressure on the Fed to ease its monetary policy further may be enhanced, thus providing some support for US equities markets. Yet we have to note that forecasts, especially for the NFP figure, seldomly tend to be verified by the actual rates and figures, thus should we see the data implying a tightening of the US employment market we may see the release weighing on US stock markets as the Fed’s doubts for further easing of its monetary policy may be enhanced further.
Technical analysis
US500 daily chart
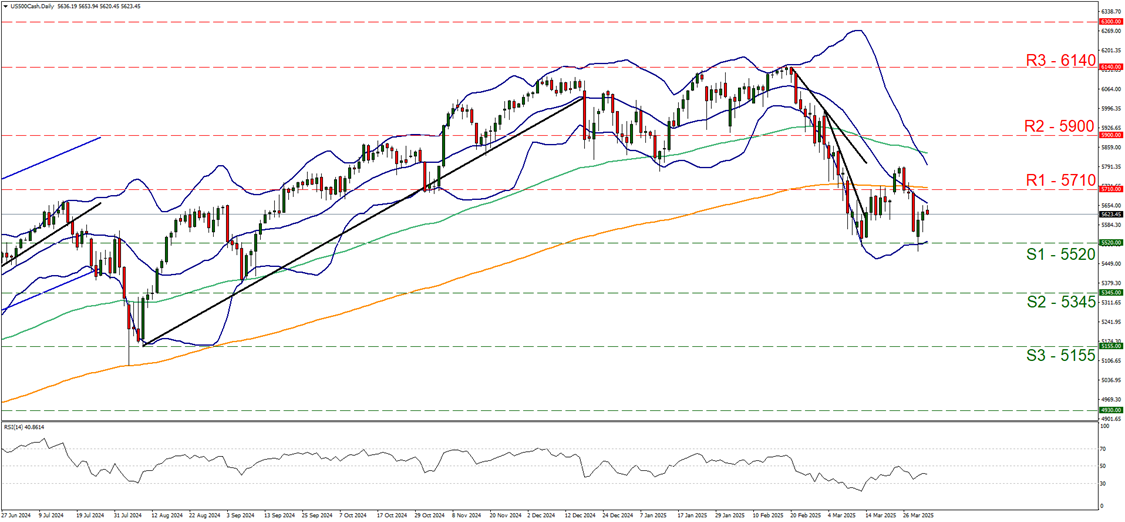
Support: 5520 (S1), 5345 (S2), 5155 (S3).
Resistance: 5710 (R1), 5900 (R2), 6140 (R3).
S&P 500 dropped since our last report yet on Monday bounced on the 5520 (S1) support line and corrected higher. In its correction higher the price action of the index, practically failed to record a lower trough than the one on the 13th of March thus verifying an interruption of its downward motion, at least temporarily. On the other hand the RSI indicator despite correcting higher, implying an easing of the bearish sentiment among market participants for the index, remains below the reading of 50 implying also that a bearish predisposition may still be present. For the time being we tend to maintain a bias for a sideways motion of S&P 500. For a bearish outlook to emerge, we would require the index to break the 5520 (S1) support line and start aiming for the 5345 (S2) support level. Should the bulls find a chance in the index correction higher and get in the driver’s seat for the index, we may see S&P 500 breaking the 5710 (R1) resistance line clearly, thus aiming if not breaching the 5900 (R2) resistance base.
Author

Peter Iosif, ACA, MBA
IronFX
Mr. Iosif joined IronFX in 2017 as part of the sales force. His high level of competence and expertise enabled him to climb up the company ladder quickly and move to the IronFX Strategy team as a Research Analyst. Mr.


