Epic Silver breakout: What next?

Weekly thoughts
There has been a massive, huge, epic! breakout in the price of silver.
Last week, silver (XAG/USD) hit $36 per oz, its highest level in 13 years.
Silver has been a top performer in 2025, now up more than 20% year to date. Although it is still lagging gold, which has powered higher by about 28%.
Regular readers will know we think this is a good thing for buying - new multi-year highs are bullish! But always the next big question after ‘buy or sell?’ is ‘when?’
Btw we actually called this breakout just before it happened in week 21’s analysis (May 25).
As a reminder, these were our comments:
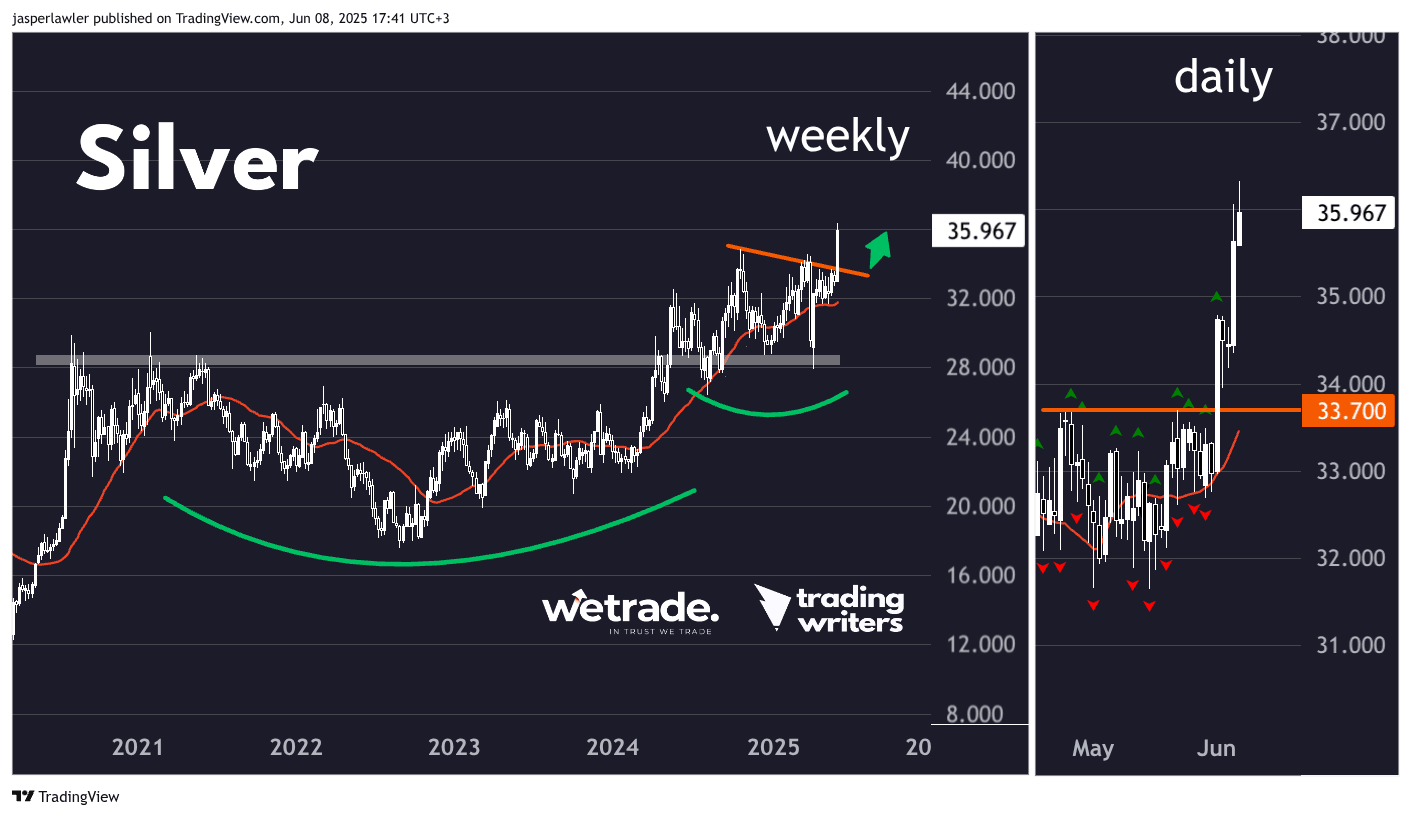
Setup: Silver’s quick recovery from the March lows, having also held the 30-week moving average in a tight consolidation before closing at a multi-week high, is bullish.
Signal: A breakout of the near term high at 33.70 offers an earlier entry than a multi-year high over 35 with less confirmation. The broken trendline should act as near term support.
So of course that entry point we last wrote about has passed and silver has now made the multi-week and multi-year high alluded to. Is it too late to get in?
Of course it might be, you can never know for sure. But we think no, it’s not.
This time around we’ve zoomed out a bit on the weekly chart of silver to give our overall impression of what’s been happening. After a big rally in 2020, silver churned sideways for 4 years until again picking up momentum at the start of 2024. It has then again chopped sideways for more-or-less 1 year until now.
In summary: A big move up, a large base, then a small base. Does that sound familiar?
It’s a cup and handle pattern. - here’s a textbook example (not silver):

Source: newtrading.io
Silver has moved from circa $33 to $36 in around 5 days. That’s about 9%.
However, if you project the height of the ‘cup’ of the pattern from the breakout point circa $34 - you end up with a long term target of $45 per oz - another $9 from current levels.
The idea behind the cup and handle pattern is that momentum has been building for years. Once the price moves beyond the breakout point - momentum is high and getting higher.
If you’re buying something AFTER it has already gone up substantially, you have to have a high conviction it is going to go up even more. You have to think the asset has momentum.
Will there be a pullback first?
Deciding the optimum entry point after a breakout pretty much boils down to this question.
Sadly, there is no definitive way to tell.
Trading on the break or waiting for a pullback back to the breakout point is really just a matter of personal preference. There are pros and cons of both. What's more important for being consistently profitable as a breakout trader is that you consistently choose the same method.
But we have a ‘hack’.
Ok, it’s not a hack but it's a way to approach trade entry after a big move. It’s known as scaling in.
So instead of buying 100% of your position size at the top of last week’s move at $36 or waiting for a pullback to the breakout point and buying 100% at $34 - you could buy 50% at both - or even 33% at $36, $35 and $34. Then, depending on the extent of any pullback, you add more to your position as the trend continues. The exact combination is down to your own risk tolerance.
Setups & signals
We look at hundreds of charts each week and present you with three of our favourite setups and signals.
Silver (XAG/USD)
Setup
Silver has broken out of a 1-year trading range to make a 13-year high. We are looking for a bullish continuation.
Signal
Price has already made a strong breakout above short term resistance. Long trades remain valid while price remains over $33.70.
GBP/JPY
Setup
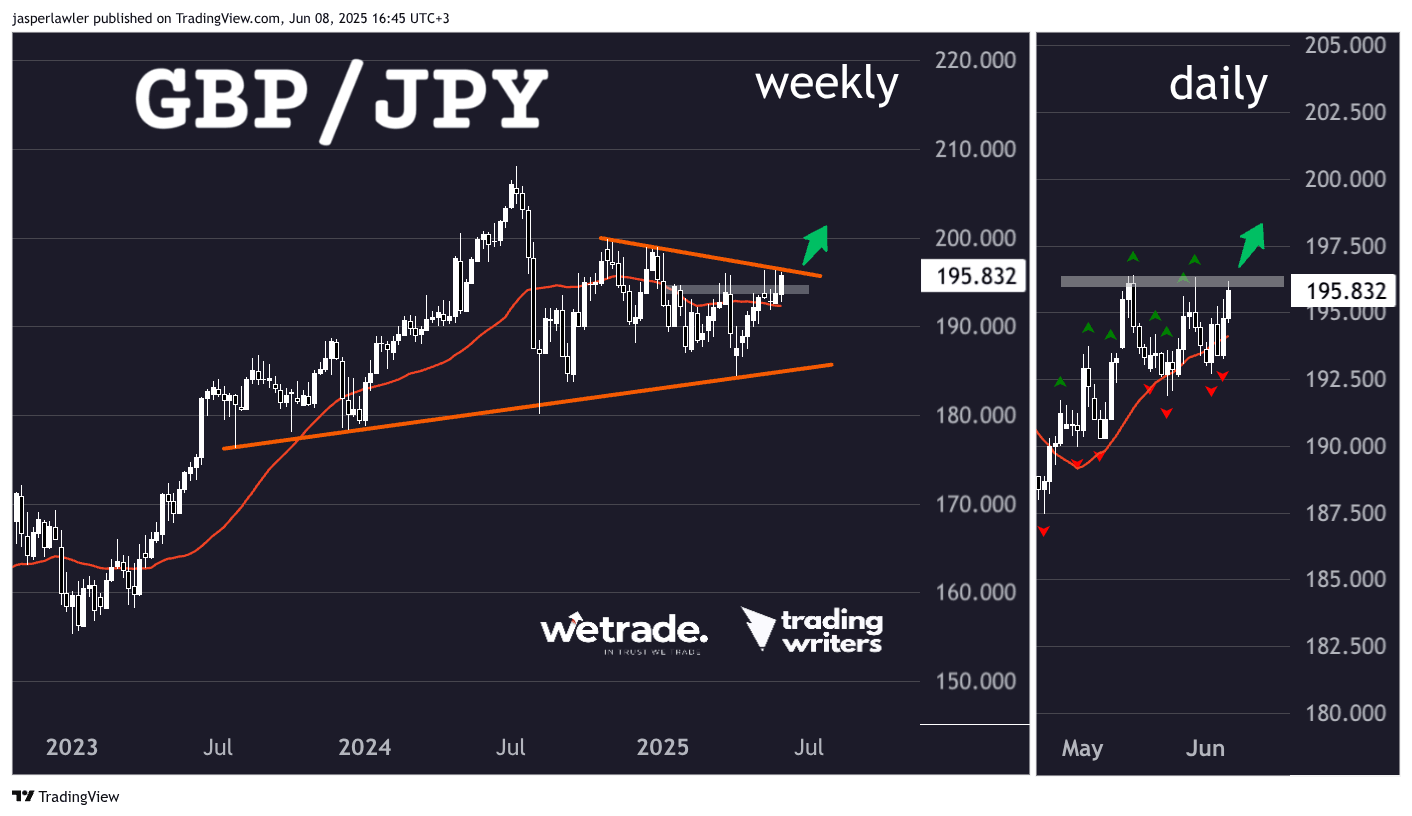
GBP/JPY is pushing up against a downtrend line formed over the 9 months or so. Although the trendline has not yet broken, the highest weekly close since January (above 195 resistance) is bullish and potentially preempts a breakout.
Signal
We are looking for a short-term breakout over $196 resistance to confirm the long term move higher.
EUR/GBP
Setup
EUR/GBP made a long term breakout from a 2-year downtrend. It has now retraced most of the move to test the broken trendline and the 30-week moving average.
Signal
A breakout above near term resistance at 0.845 could confirm the beginning of the move back up. It comes following a bullish engulfing candlestick pattern that created a fakeout below 0.84.

Author

Jasper Lawler
Trading Writers
With 18 years of trading experience, Jasper began his career as a stockbroker on Wall Street in New York City before sharpening his analytical skills at top trading firms in the City of London.


