USD: Dec '24 is Up at 103.100.

Energies: Nov '24 Crude is Down at 70.22.

Financials: The Dec '24 30 Year T-Bond is Up 11 ticks and trading at 121.13.

Indices: The Dec '24 S&P 500 emini ES contract is 8 ticks Higher and trading at 5864.75.

Gold: The Dec'24 Gold contract is trading Up at 2691.20.

Initial conclusion

This is not a correlated market.  The USD is Up and Crude is Down which is normal, and the 30 Year T-Bond is trading Higher.  The Financials should always correlate with the US dollar such that if the dollar is Higher, then the bonds should follow and vice-versa. The S&P is Higher and Crude is trading Lower which is correlated. Gold is trading Higher which is not correlated with the US dollar trading Up.  I tend to believe that Gold has an inverse relationship with the US Dollar as when the US Dollar is down, Gold tends to rise in value and vice-versa. Think of it as a seesaw, when one is up the other should be down. I point this out to you to make you aware that when we don't have a correlated market, it means something is wrong. As traders you need to be aware of this and proceed with your eyes wide open. Asia traded Lower with the exception of the Shanghai exchange.  Europe is trading mainly Lower with the exception of the London exchange. 

Possible challenges to traders

  • Import Prices m/m is out at 8:30 AM EST. This is Major.

  • Lack of Major Economic News.

Traders, please note that we've changed the Bond instrument from the 10 year (ZN) to the 2 year (ZT).  They work exactly the same.  

We've elected to switch gears a bit and show correlation between the 2-year Treasury notes (ZT) and the S&P futures contract.  The YM contract is the Dow Jones Industrial Average, and the purpose is to show reverse correlation between the two instruments.  Remember it's likened to a seesaw, when up goes up the other should go down and vice versa.

Yesterday the ZT migrated Higher at around 8:30 AM EST with the Empire State Manufacturing Index looming and began its Upward Climb.  Look at the charts below and you'll see a pattern for both assets. The Dow moved Lower at 8:30 AM and the ZT moved Higher at around the same time.  These charts represent the newest version of Bar Charts, and I've changed the timeframe to a 15-minute chart to display better.  This represented a Long opportunity on the 2-year note, as a trader you could have netted about 20 plus ticks per contract on this trade.   Each tick is worth $7.625.  Please note: the front month for ZT is Dec and the Dow is now Dec '24.  I've changed the format to filled Candlesticks (not hollow) such that it may be more apparent and visible.

Charts courtesy of Barcharts

Chart

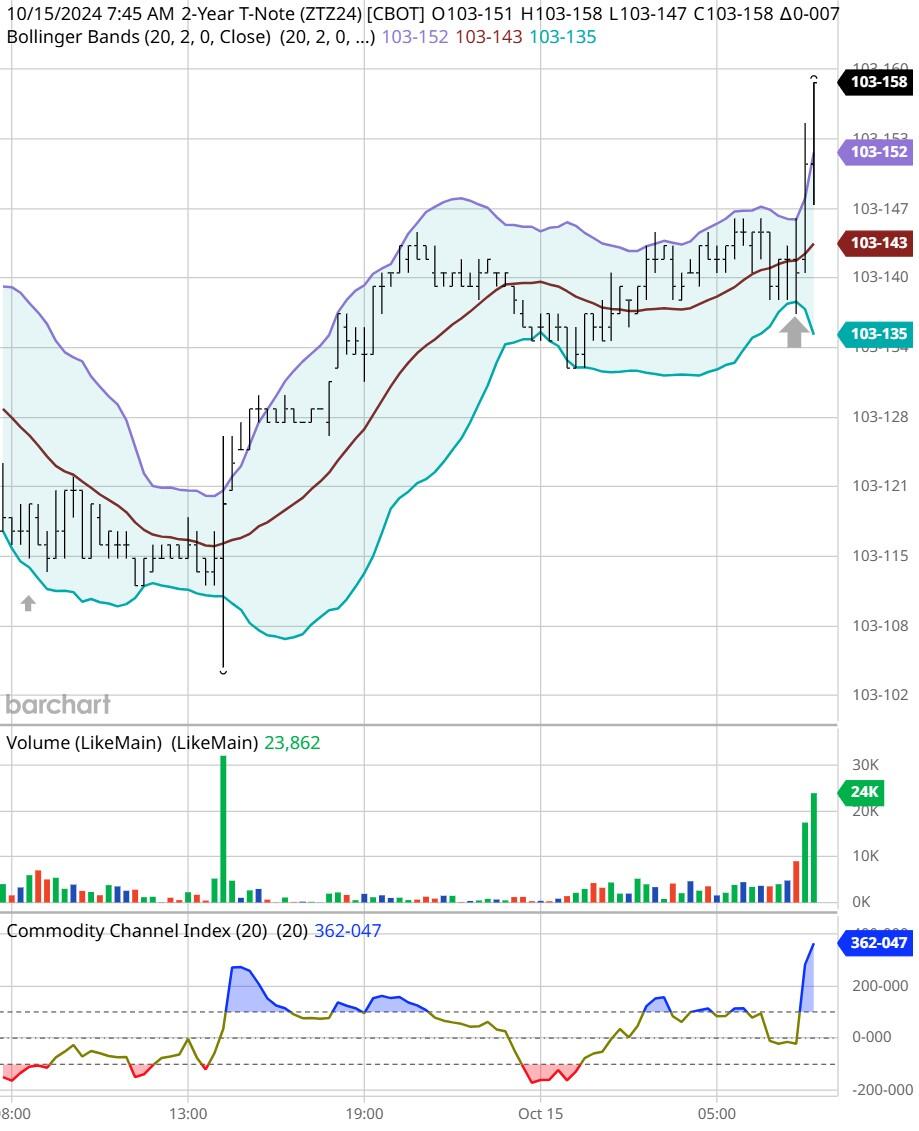
ZT -Dec 2024 - 10/15/24

Chart

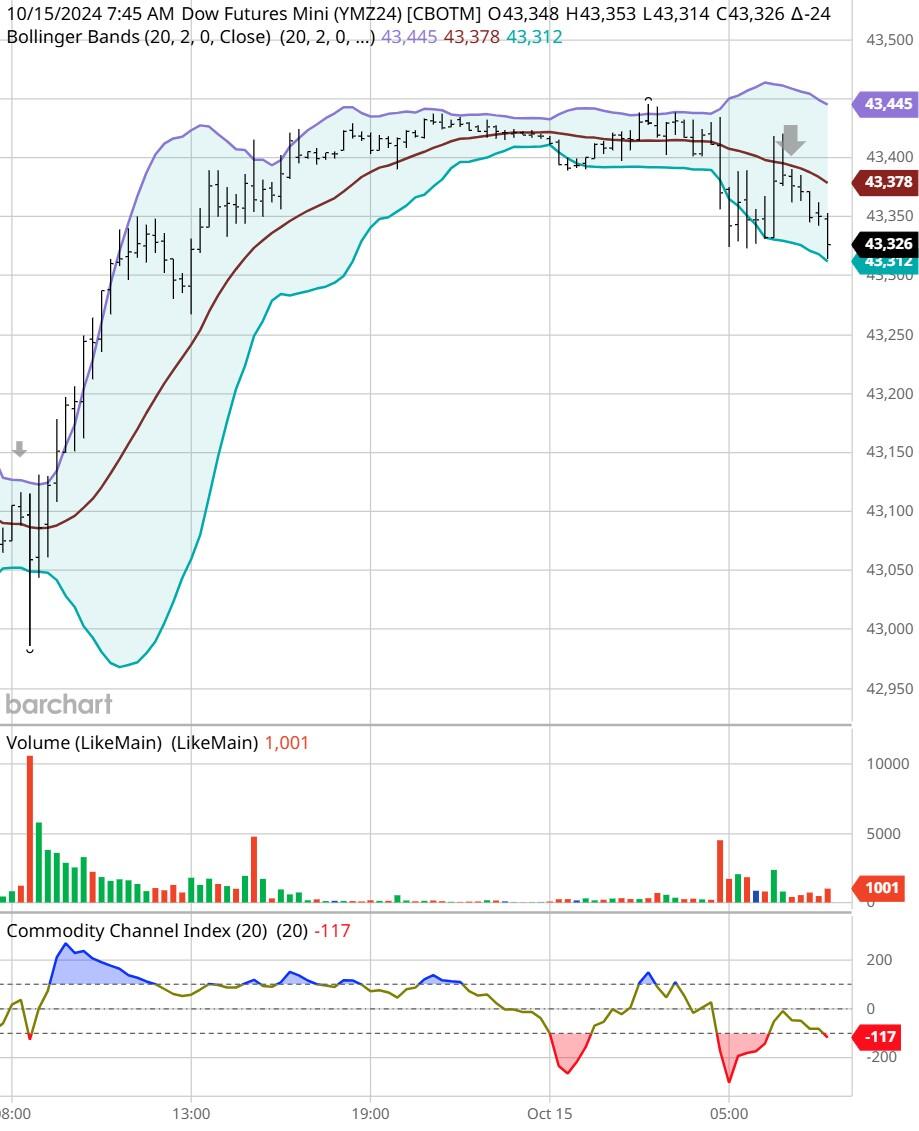
Dow - Dec 2024- 10/15/24

Bias

Yesterday we gave the markets a Mixed or Neutral bias as we saw no evidence of market correlation Tuesday morning and the market veered to the Downside with the Dow dropping 325 points and the other indices closed Lower as well.  Today we aren't dealing with a correlated market, and our bias is Neutral or Mixed.

Could this change? Of Course.  Remember anything can happen in a volatile market.

Commentary

Yesterday we gave the markets a Neutral bias as we saw no evidence of market correlation Tuesday morning.  The Empire State Manufacturing Index came in at a minus or negative 11.7.  This was not what anyone was expecting and the markets traded Lower yesterday.  It is good to see that economic news still plays a factor in these markets.  Today we only have Import Prices and nothing else.  Will this be enough to perhaps turn the markets around?  Only time will tell...

Trading performance displayed herein is hypothetical. The following Commodity Futures Trading Commission (CFTC) disclaimer should be noted.

Hypothetical performance results have many inherent limitations, some of which are described below. No representation is being made that any account will or is likely to achieve profits or losses similar to those shown.

In fact, there are frequently sharp differences between hypothetical performance results and the actual results subsequently achieved by any particular trading program. One of the limitations of hypothetical performance trading results is that they are generally prepared with the benefit of hindsight.

In addition, hypothetical trading does not involve financial risk, and no hypothetical trading record can completely account for the impact of financial risk in actual trading. For example, the ability to withstand losses or to adhere to a particular trading program in spite of trading losses are material points which can also adversely affect actual trading results.

There are numerous other factors related to the markets in general or to the implementation of any specific trading program which cannot be fully accounted for in the preparation of hypothetical performance results and all of which can adversely affect actual trading results.

Trading in the commodities markets involves substantial risk and YOU CAN LOSE A LOT OF MONEY, and thus is not appropriate for everyone. You should carefully consider your financial condition before trading in these markets, and only risk capital should be used.

In addition, these markets are often liquid, making it difficult to execute orders at desired prices. Also, during periods of extreme volatility, trading in these markets may be halted due to so-called “circuit breakers” put in place by the CME to alleviate such volatility. In the event of a trading halt, it may be difficult or impossible to exit a losing position.

Recommended Content


Recommended Content

Editors’ Picks

EUR/USD holds near 1.0900 ahead of key ECB meeting

EUR/USD holds near 1.0900 ahead of key ECB meeting

EUR/USD recovers modestly from multi-month lows and fluctuates at around 1.0900 Wednesday. The cautious market mood ahead of Thursday's ECB policy announcements, however, makes it difficult for the pair to continue to stretch higher. 

EUR/USD News
GBP/USD recovers above 1.3000 after earlier selloff

GBP/USD recovers above 1.3000 after earlier selloff

GBP/USD recovers from the multi-month low it set near 1.2980 and trades above 1.3000. The data from the UK showed that the annual CPI inflation declined to 1.7% in September from 2.2% in August, weighing heavily on the Pound Sterling in the early European session.

GBP/USD News
Gold closes in on new record high above $2,980

Gold closes in on new record high above $2,980

Gold price scales higher for the second straight day on Wednesday – also marking the fourth day of a positive move in the previous five – and climbs toward the all-time-high it set at $2,685 in late September. 

Gold News
Why is the ECB set to cut interest rates again and what does that mean

Why is the ECB set to cut interest rates again and what does that mean

The ECB is widely expected to cut interest rates on Thursday for the third time this year. This is a significant achievement as it suggests that the ECB, which sets monetary policy in the Eurozone, is accelerating its path towards lower interest rates after an unprecedented increase.

Read more
British inflation dips to 1.7% in September

British inflation dips to 1.7% in September

And speaking of inflation and Europe, inflation in Britain not only fell below 2% in September but came in significantly lower than expected (1.7%y-o-y vs 1.9% expected). 

Read more
Best Forex Brokers with Low Spreads

Best Forex Brokers with Low Spreads

VERIFIED Low spreads are crucial for reducing trading costs. Explore top Forex brokers offering competitive spreads and high leverage. Compare options for EUR/USD, GBP/USD, USD/JPY, and Gold.

Read More

Majors

Cryptocurrencies

Signatures