|

Elliott Wave View: IYR new all-time-high in sight [Video]

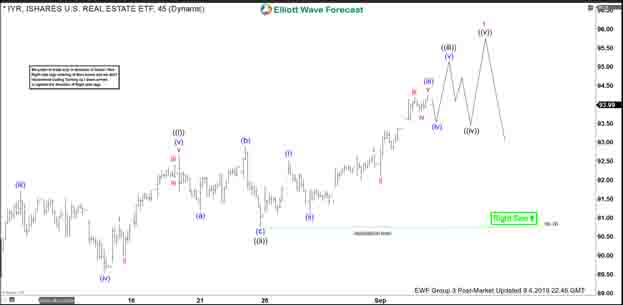
IYR is the ticker symbol for U.S. Real Estate ETF. Since the financial crash in 2009, the instrument is steadily rising and currently only $1 from breaking the 2007 all-time high. In the short term chart below, we can see the rally is unfolding as an 5 waves impulsive Elliott Wave structure. The impulsive rally started from August 16, 2019 low where wave ((i)) ended at 92.66 and wave ((ii)) ended at 90.75. Wave ((iii)) is in progress and unfolding as another impulse Elliott Wave structure in lesser degree.

A 100% Fibonacci extension measurement from August 6 gives us a possible short term target of 96.45 – 97.8. This can be a possible short term target to the upside. Near term, while pullback stays above 90.76, expect the instrument to extend higher. We do not like selling the instrument. Dips should find buyers in 3, 7, or 11 swing as far as pivot at 90.76 low stays intact. In the larger degree, if IYR makes all-time high by breaking above 2007 high (95), that should create a bullish sequence and open further upside in the larger degree.

IYR 1 Hour Elliott Wave Chart

IYR

IYR 1 Hour Elliott Wave Video

Author

Elliott Wave Forecast Team

Elliott Wave Forecast Team

ElliottWave-Forecast.com

More from Elliott Wave Forecast Team
Share:

Editor's Picks

EUR/USD looks offered below 1.1900

EUR/USD keeps its bearish tone unchanged ahead of the opening bell in Asia, returning to the sub-1.1900 region following a firmer tone in the US Dollar. Indeed, the pair reverses two consecutive daily gains amid steady caution ahead of Wednesday’s key US Nonfarm Payrolls release.
 

GBP/USD slips back to daily lows near 1.3640

GBP/USD drops to daily lows near 1.3640 as sellers push harder and the Greenback extends its rebound in the latter part of Tuesday’s session. Looking ahead, the combination of key US releases, including NFP and CPI, alongside important UK data, should keep the pound firmly in focus over the coming days.

Gold the battle of wills continues with bulls not ready to give up

Gold remains on the defensive and approaches the key $5,000 region per troy ounce on Tuesday, giving back part of its recent two day. The precious metal’s pullback unfolds against a firmer tone in the US Dollar, declining US Treasury yields and steady caution ahead of upcoming key US data releases.

Bitcoin's downtrend caused by ETF redemptions and AI rotation: Wintermute

Bitcoin's (BTC) fall from grace since the October 10 leverage flush has been spearheaded by sustained ETF outflows and a rotation into the AI narrative, according to Wintermute.

Dollar drops and stocks rally: The week of reckoning for US economic data

Following a sizeable move lower in US technology Stocks last week, we have witnessed a meaningful recovery unfold. The USD Index is in a concerning position; the monthly price continues to hold the south channel support.

XRP holds $1.40 amid ETF inflows and stable derivatives market

Ripple trades under pressure, with immediate support at $1.40 holding at the time of writing on Tuesday. A recovery attempt from last week’s sell-off to $1.12 stalled at $1.54 on Friday, leading to limited price action between the current support and the resistance.