|

Elliott Wave View: High Frequency Box Suggested Natural Gas Sell Off

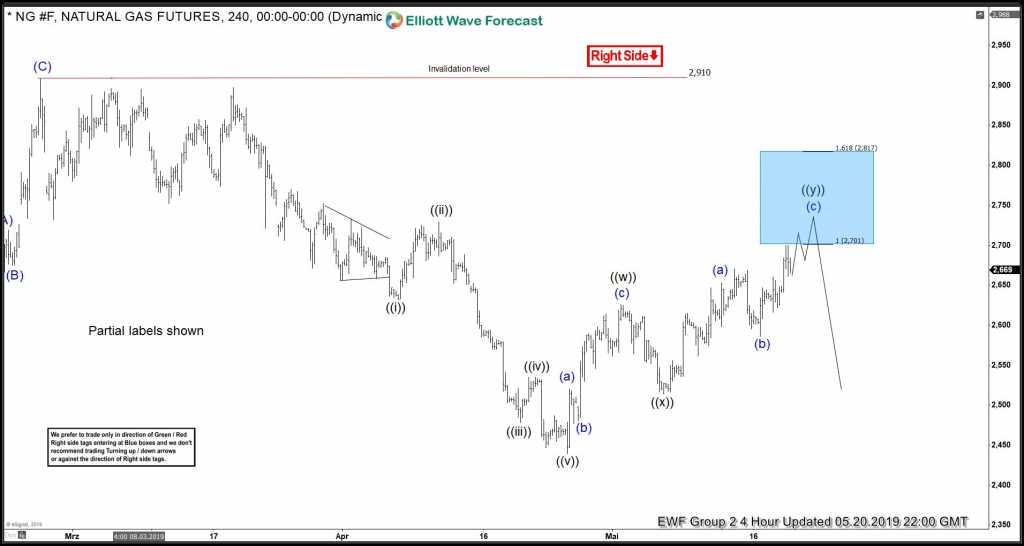
I want to share with you some Elliott Wave charts of Natural Gas Futures which we presented last month. You see the 4-hour updated chart presented to our clients on the 5/20/19. Natural Gas had a 4-hour right side tag against 2.910 peak suggesting more downside.

It ended the cycle from 02/27/19 peak in black wave ((v)) at 04/25/19 low (2.439). Above from there, we expected a bounce to occur. The bounce unfolded in an Elliott Wave double three correction. We advised members that Natural Gas should continue lower. Therefore, we expected sellers to appear in the sequences of 3, 7 or 11 swings. At the 100 – 1.618 Fibonacci extension of black (w)-(x) which came at around 2.701-2.817 area and that was the first area for selling the commodity.

Natural Gas 5.20.2019 4 Hour Chart Elliott Wave Analysis

NG

Natural Gas

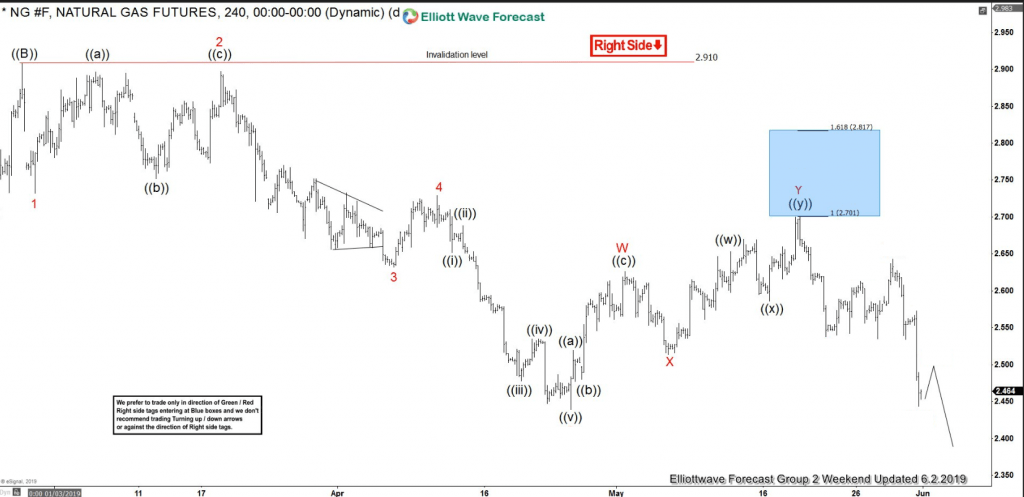
In the last Elliott Wave chart. You can see that it reached the blue box area. So traders could have opened a short position at the blue box. The Gas reacted perfectly lower. Any trades from our blue box area shown in the chart above were risk-free, which means the stop-loss should be moved to break even looking for lower levels. Please keep in mind that the 4-hour chart which I presented has changed. This blog should just illustrate how accurate our blue boxes are, and how our members trade our 3-7 or 11 swings strategy.

Natural Gas 6.02.2019 4 Hour Chart Elliott Wave Analysis

NG

Interested in active FX or CRYPTO Elliott Wave labeled charts on a daily basis? Now it's your time; we have a SPECIAL offer; 50% Off on FX and Crypto markets. Check Elliott Wave Forecast website for more details.

Author

Elliott Wave Forecast Team

Elliott Wave Forecast Team

ElliottWave-Forecast.com

More from Elliott Wave Forecast Team
Share:

Editor's Picks

EUR/USD flat lines around 1.1900; looks to US NFP report for fresh directional impetus

The EUR/USD pair is seen oscillating in a narrow trading band around the 1.1900 mark during the Asian session on Wednesday as traders opt to wait for the release of US monthly employment details before placing fresh directional bets.

GBP/USD slips back to daily lows near 1.3640

GBP/USD drops to daily lows near 1.3640 as sellers push harder and the Greenback extends its rebound in the latter part of Tuesday’s session. Looking ahead, the combination of key US releases, including NFP and CPI, alongside important UK data, should keep the pound firmly in focus over the coming days.

Gold recovers to $5,050, focus shifts to US jobs data

Gold turns higher to test $5,050 in the Asian session on Wednesday. Traders assess whether Gold has found a floor following a historic sell-off. The delayed US employment report for January, which was pushed back due to the recently ended four-day government shutdown, will take center stage later on Wednesday.

Ethereum: Whales buy the dip amid rising short bets

Following one of Ethereum's largest weekly drawdowns, whales are slowly returning to action alongside a drop in retail selling pressure. After slightly selling into the decline at the start of the month, whales or wallets with a balance of 10K-100K ETH began buying the dip last Wednesday as prices crashed further. 

Dollar drops and stocks rally: The week of reckoning for US economic data

Following a sizeable move lower in US technology Stocks last week, we have witnessed a meaningful recovery unfold. The USD Index is in a concerning position; the monthly price continues to hold the south channel support.

XRP holds $1.40 amid ETF inflows and stable derivatives market

Ripple trades under pressure, with immediate support at $1.40 holding at the time of writing on Tuesday. A recovery attempt from last week’s sell-off to $1.12 stalled at $1.54 on Friday, leading to limited price action between the current support and the resistance.