|

Elliott Wave view: GBP/USD short term remains bearish [Video]

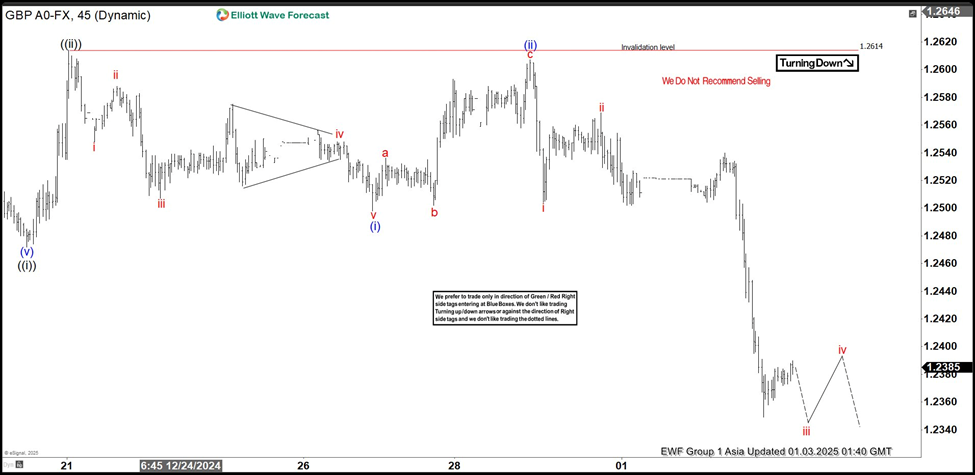
Short Term Elliott Wave view in GBPUSD suggests decline from 12.6.2024 high is in progress as a 5 waves impulse. Down from 12.6.2024 high, wave ((i)) ended at 1.247 and wave ((ii)) rally ended at 1.261 as the 45 minutes chart below shows. Pair has turned lower in wave ((iii)) with internal subdivision as another impulse. Down from wave ((ii)), wave i ended at 1.2548 and rally in wave ii ended at 1.2588. Pair resumed lower in wave iii towards 1.2507. Wave iv rally ended at 1.2548 and wave v lower ended at 1.2498 which completed wave (i) in higher degree. Rally in wave (ii) ended at 1.2607 with internal subdivision as a zigzag.

Up from wave (i), wave a ended at 1.2536 and wave b ended at 1.2502. Wave c higher ended at 1.2607 which completed wave (ii). Pair has turned lower in wave (iii). Down from wave (ii), wave i ended at 1.2504 and wave ii ended at 1.2569. Expect pair to extend lower to end wave iii, then it should rally in wave iv before turning lower again. Near term, as far as pivot at 1.2614 high stays intact, expect rally to fail in 3, 7, or 11 swing for further downside.

GBP/USD 45 minutes Elliott Wave chart

Chart

GBP/USD Elliott Wave [Video]

Author

Elliott Wave Forecast Team

Elliott Wave Forecast Team

ElliottWave-Forecast.com

More from Elliott Wave Forecast Team
Share:

Editor's Picks

EUR/USD trims gains, hovers around 1.1900 post-US data

EUR/USD trades slightly on the back foot around the 1.1900 region in a context dominated by the resurgence of some buying interest around the US Dollar on turnaround Tuesday. Looking at the US docket, Retail Sales disappointed expectations in December, while the ADP 4-Week Average came in at 6.5K.

GBP/USD comes under pressure near 1.3680

The better tone in the Greenback hurts the risk-linked complex on Tuesday, prompting GBP/USD to set aside two consecutive days of gains and trade slightly on the defensive below the 1.3700 mark. Investors, in the meantime, keep their attention on key UK data due later in the week.

Gold loses some traction, still above $5,000

Gold faces some selling pressure on Tuesday, surrendering part of its recent two-day advance although managing to keep the trade above the $5,000 mark per troy ounce. The daily pullback in the precious metal comes in response to the modest rebound in the US Dollar, while declining US Treasury yields across the curve seem to limit the downside.

XRP holds $1.40 amid ETF inflows and stable derivatives market

Ripple trades under pressure, with immediate support at $1.40 holding at the time of writing on Tuesday. A recovery attempt from last week’s sell-off to $1.12 stalled at $1.54 on Friday, leading to limited price action between the current support and the resistance.

Dollar drops and stocks rally: The week of reckoning for US economic data

Following a sizeable move lower in US technology Stocks last week, we have witnessed a meaningful recovery unfold. The USD Index is in a concerning position; the monthly price continues to hold the south channel support.

XRP holds $1.40 amid ETF inflows and stable derivatives market

Ripple trades under pressure, with immediate support at $1.40 holding at the time of writing on Tuesday. A recovery attempt from last week’s sell-off to $1.12 stalled at $1.54 on Friday, leading to limited price action between the current support and the resistance.