|

Elliott Wave intraday analysis on Silver (XAG/USD) looking to find buyers [Video]

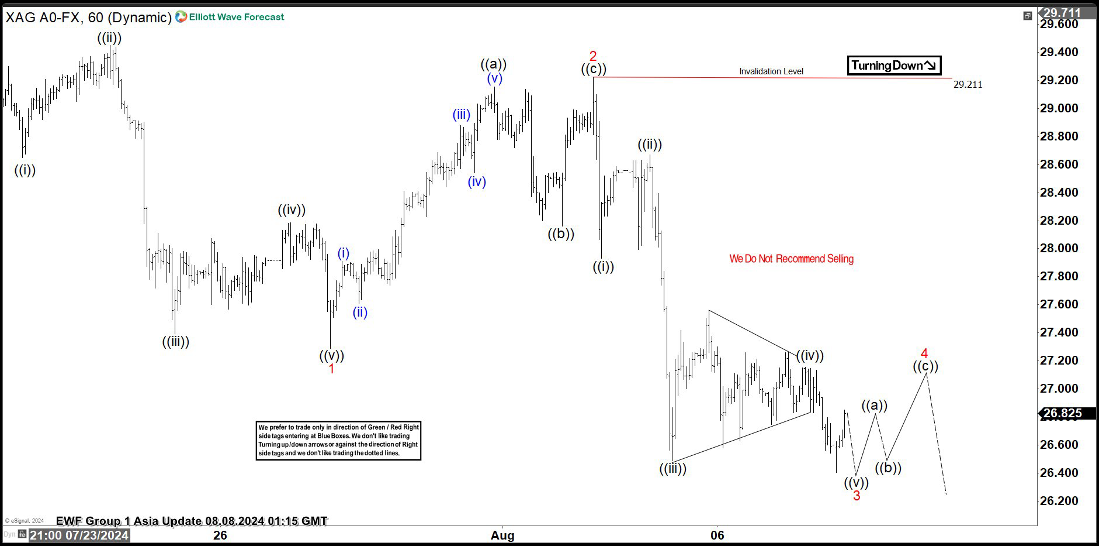
Short term Elliott Wave view in Silver (XAG/USD) suggests that pullback to 28.58 low ended a wave (A). The metal turned higher again in wave (B) ended at 31.75 high. The market resuming lower from wave (B) high breaking below 28.58 low to rule a larger correction. It means, Silver is developing a wave (C) of ((4)) as a zig zag Elliott Wave structure. Down from wave (B), wave ((i)) ended at 28.65 and wave ((ii)) ended at 29.45. Wave ((iii)) lower ended at 27.40, and pullback in wave ((iv)) ended at 28.19. Wave ((v)) ended at 27.29 which completed wave 1. Pullback in wave 2 ended at 29.22 high and the metal resumed lower in wave 3.

Down from wave 2, wave ((i)) ended at 27.93 and wave ((ii)) ended at 28.67. Wave ((iii)) lower ended at 26.49, and pullback in wave ((iv)) built a triangle structure ended at 27.16. Currently, silver is trading in wave ((v)) of 3. We are calling for one more low to end the cycle. The ideal place to end this wave comes in 26.32 – 26.06 area, where buyers should appear to start wave 4 pullback. Near term, as far as pivot at 29.22 high stays intact, expect pullback as wave 4 to fail in 3, 7 or 11 swing for further downside in wave 5 of (C).

Silver (XAG/USD) 60 minutes Elliott Wave chart

XAG/USD Elliott Wave [Video]

Author

Elliott Wave Forecast Team

Elliott Wave Forecast Team

ElliottWave-Forecast.com

More from Elliott Wave Forecast Team
Share:

Editor's Picks

EUR/USD holds above 1.1750 after mixed EU PMI data

EUR/USD manages to hold above 1.1750 but struggles to gather recovery momentum on Friday, following the mixed February PMI figures from Germany and the Eurozone. In the second half of the day, Q4 GDP, December inflation and February PMI data from the US will be watched closely by market participants.

GBP/USD recovers further toward 1.3500 after UK PMI data

GBP/USD is recovering ground further toward 1.3500 in European trading on Friday, helped by a modest uptick in the Pound Sterling after stronger-than-expected UK January Retail Sales and February PMI data. However, the pair's further upside could be limited amid persistent US Dollar strength as the focus turns to key US data. 

Gold sticks to positive bias above $5,000 ahead of US data

Gold gains some positive traction for the third consecutive day on Friday. holding above $5,000. Traders now look forward to the key US macro releases – the Advance Q4 GDP report and the Personal Consumption Expenditures (PCE) Price Index – for fresh trading impetus. 

US GDP growth expected to slow down significantly in Q4 after stellar Q3 

The United States Bureau of Economic Analysis will publish the first preliminary estimate of the fourth-quarter Gross Domestic Product at 13:30 GMT. Analysts forecast the US economy to have expanded at a 3% annualized rate, slowing down from the 4.4% growth posted in the previous quarter.

Iran tensions and AI fears at the forefront ahead of key US data

Thursday’s scorecard shows major US Stock benchmarks closed modestly in the red amid mounting US-Iran tensions and AI disruption worries. The S&P 500 shed 19 points (0.3%) to 6,861, the Nasdaq 100 lost 101 points (0.4%) to 24,797, and the Dow Jones Industrial Average dropped 267 points (0.5%) to 49,395.

Official Trump price approaches breakout with mixed signals from traders

Official Trump (TRUMP) is trading at $3.50 at the time of writing, approaching its upper consolidation range. A breakout from this range could open the door for an upside move. On-chain data shows market indecision, with balanced flows between bulls and bears, signaling a lack of clear directional bias.