Elliott Wave analysis: USD/CAD turning upside from sideways

Today, we will discuss USD/CAD as the pair is set to break out of a range that has lasted over two years. How soon can the breakout happen?
In May 2021, USD/CAD completed a five-year-long bearish corrective cycle that started in January 2016. Since then, the long-term bullish trend from 2007 has resumed. Despite that the pair has spent most of the last two years in a range, a breakout is imminent. The pair is expected to break out of the range in the long term. Afterward, the bullish sequence should extend beyond the January 2016 top towards prices not seen since 2003.
USD/CAD Elliott Wave analysis – Weekly chart, 07.24.2024
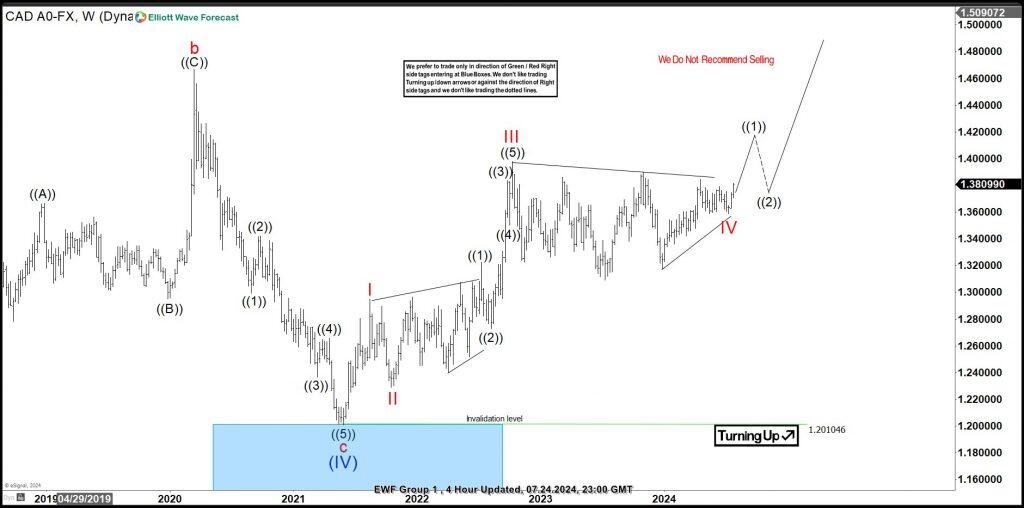
Recently, on 07.24.2024, we shared the USDCAD weekly chart with members of Elliottwave-Forecast to show the long-term path. Our Elliott wave analysis calls for the extension of wave (V) of the supercycle degree that started in May 2021, where wave (IV) ended at the equal leg. The blue box shows where long-term buyers entered into positions. They are now in a risk-free area where they can anticipate more gains. Meanwhile, the price has completed sub-waves I to IV of (V). Wave IV ended as a triangle structure that lasted over two years. Thus, we are calling for wave ((1)) of V to extend out of the range with a 5-wave structure. Along wave ((1))’s path, we will buy the pullbacks in 3, 7, or 11 swings at the extreme on the H4 or Daily chart.
USD/CAD Elliott Wave analysis – Four-hour chart, 07.24.2024
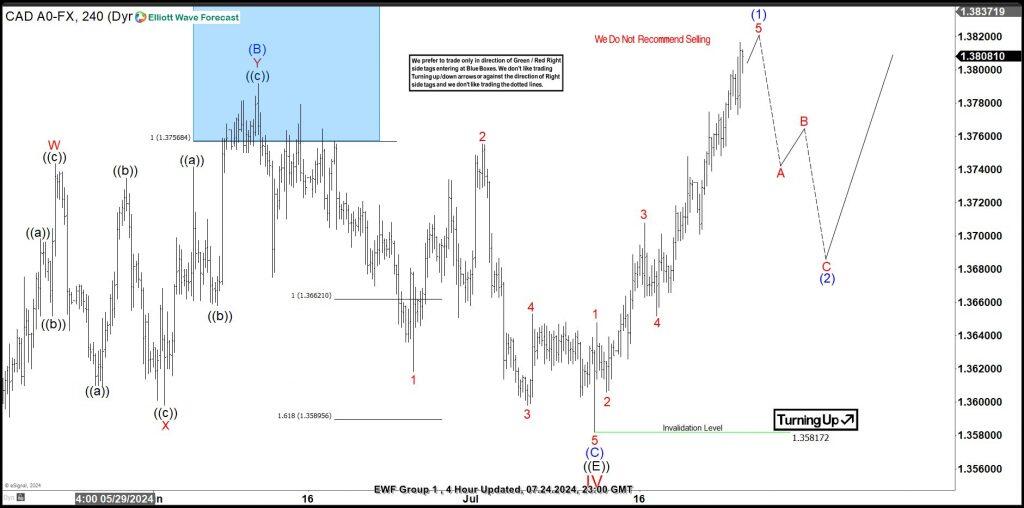
The chart above shows the shorter cycles on the H4 chart. We also shared this chart with members on 07.24.2024. The chart shows the early progress of wave V of (V). An impulse sequence appears to be emerging and close to completion from the July 2024 low. This bullish impulse sequence is expected to complete wave (1) of ((1)) of V of (V). Eventually, wave (1) will be completed, and a pullback in wave (2) will follow. Buyers will wait to buy again at the end of wave (2) if it completes a 3, 7, or 11 swing at the extreme.
Trading can be simple if we know how to identify the market’s direction and follow it diligently. We can then trade in this direction by buying pullbacks within a bullish sequence and selling bounces within a bearish sequence. In the case of USDCAD, it’s a bullish sequence. This is one of the features of our service. Members receive the best path to trade from the weekly time frame to the 1Hr/30 Min time frame. Traders can wait for the blue box for entry or trade with their strategies in the direction of our forecast. It’s a win/win for everybody.
Author

Elliott Wave Forecast Team
ElliottWave-Forecast.com


