Elliott Wave analysis expects GBP/USD to pullback in wave two [Video]
![Elliott Wave analysis expects GBP/USD to pullback in wave two [Video]](https://editorial.fxstreet.com/images/Markets/Currencies/Majors/GBPUSD/iStock-1178148633_XtraLarge.jpg)
Short Term Elliott Wave in GBPUSD suggests rally from 4.22.2024 low unfolded as a 5 waves impulse Elliott Wave structure. Up from 4.22.2024 low, wave ((i)) ended at 1.2635 and pullback in wave ((ii)) ended at 1.2445. The pair extends higher again in wave ((iii)) with internal subdivision as an impulse in lesser degree. The 1 hour chart below shows the subdivision of wave ((iii)).
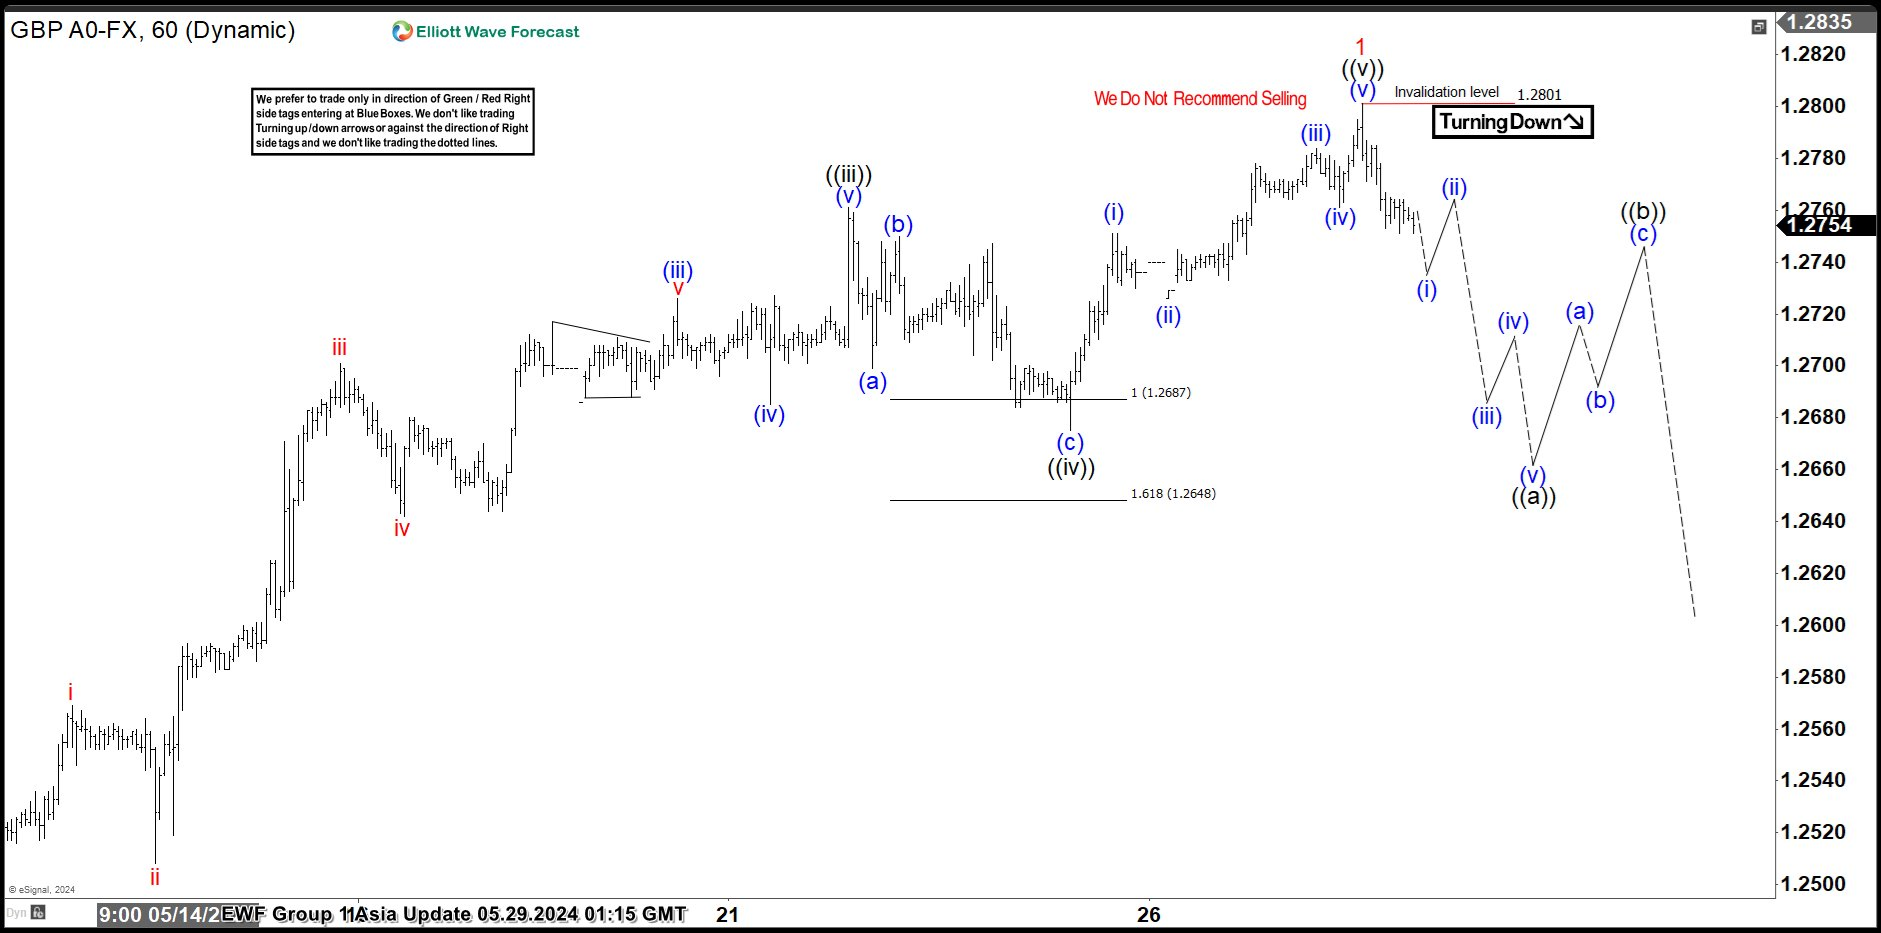
Up from wave ((ii)), wave (i) ended at 1.2541 and dips in wave (ii) ended at 1.2502. GBPUSD then extended higher in wave (iii) towards 1.2726 and pullback in wave (iv) ended at 1.2685. Final leg wave (v) ended at 1.2761 which completed wave ((iii)). The pair then pullback in wave ((iv)) towards 1.2675 and extended higher in wave ((v)) to end at 1.2801 high completing wave 1 in higher degree. Near term, as far as pivot at 1.2801 high stays intact, expect dips to find support in 3, 7 or 11 swing pullback to end wave 2 correction before further upside.
GBP/USD 60 minutes Elliott Wave chart
GBP/USD Elliott Wave [Video]
Author

ElliottWaveForex.com Team
ElliottWaveForex.com
ElliottWaveForex.com provides technical analysis of currency markets from a pure Elliott Wave perspective.


