Election day: To be continued

USD: Dec '24 is Up at 105.225.
Energies: Dec '24 Crude is Down at 70.82.
Financials: The Dec '24 30 Year T-Bond is Down 89 ticks and trading at 115.12.
Indices: The Dec '24 S&P 500 emini ES contract is 508 ticks Higher and trading at 5939.00.
Gold: The Dec'24 Gold contract is trading Down at 2707.40.
Initial conclusion
This is a nearly correlated market. The USD is Up and Crude is Down which is normal, but the 30 Year T-Bond is trading Lower. The Financials should always correlate with the US dollar such that if the dollar is Higher, then the bonds should follow and vice-versa. The S&P is Higher and Crude is trading Lower which is correlated. Gold is trading Lower which is correlated with the US dollar trading Up. I tend to believe that Gold has an inverse relationship with the US Dollar as when the US Dollar is down, Gold tends to rise in value and vice-versa. Think of it as a seesaw, when one is up the other should be down. I point this out to you to make you aware that when we don't have a correlated market, it means something is wrong. As traders you need to be aware of this and proceed with your eyes wide open. Asia traded Mixed. All of Europe is trading mainly Higher except the Milan and Spanish Ibex exchanges.
Possible challenges to traders
-
Crude Oil Inventories is out at 10:30 AM EST. This is Major.
-
30 Year Bond Auction starts at 1 PM EST. This is Major.
Traders, please note that we've changed the Bond instrument from the 10 year (ZN) to the 2 year (ZT). They work exactly the same.
We've elected to switch gears a bit and show correlation between the 2-year Treasury notes (ZT) and the S&P futures contract. The YM contract is the Dow Jones Industrial Average, and the purpose is to show reverse correlation between the two instruments. Remember it's likened to a seesaw, when up goes up the other should go down and vice versa.
Yesterday the ZT leapt Higher at around 8:30 AM EST as the Trade Balance numbers were reported. The Dow dived Lower at the same time. Look at the charts below and you'll see a pattern for both assets. The Dow moved Higher at 8:30 AM and the ZT moved Lower at around the same time. These charts represent the newest version of Bar Charts, and I've changed the timeframe to a 15-minute chart to display better. This represented a Long opportunity on the 2-year note, as a trader you could have netted about a dozen ticks per contract on this trade. Each tick is worth $7.625. Please note: the front month for ZT is Dec and the Dow is now Dec '24. I've changed the format to filled Candlesticks (not hollow) such that it may be more apparent and visible.
Charts courtesy of Barcharts
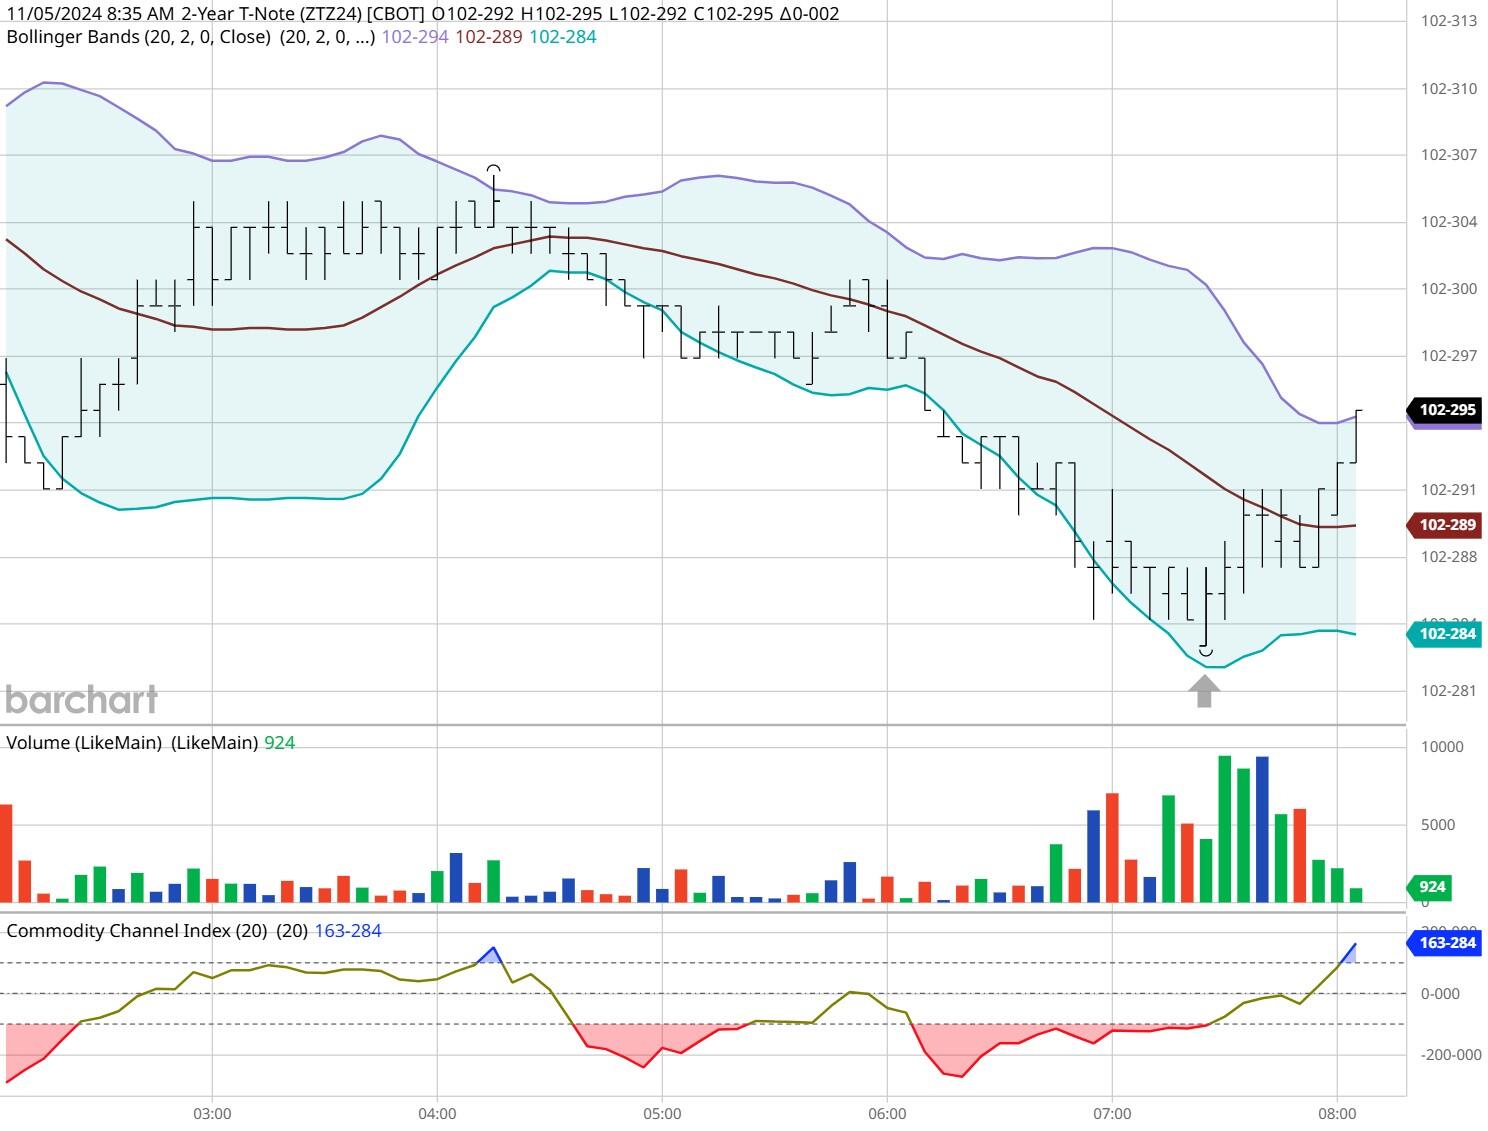
ZT -Dec 2024 - 11/05/24
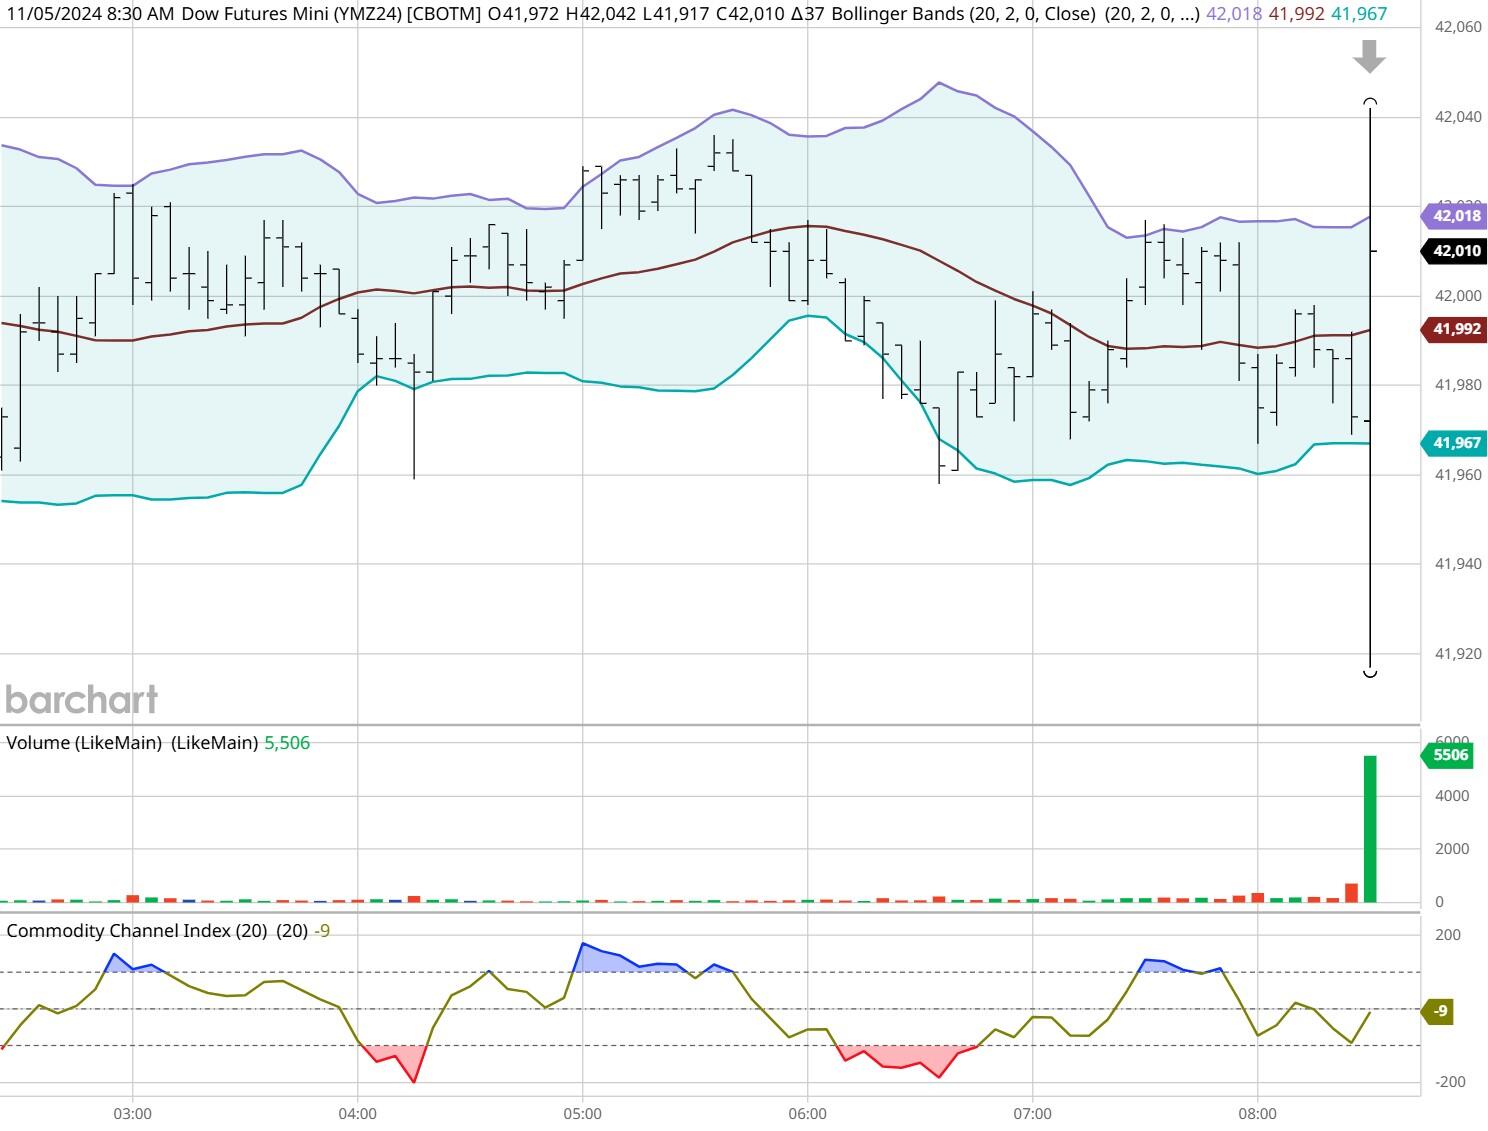
Dow - Dec 2024- 11/05/24
Bias
Yesterday we gave the markets a Neutral or Mixed bias; which means the markets could go anywhere and often does. Yesterday the markets migrated Higher with the Dow gaining 427 points and the other indices gained ground as well. Today we are dealing with a nearly correlated market, and our bias is to the Upside.
Could this change? Of Course. Remember anything can happen in a volatile market.
Commentary
As I write this the Presidential Election is still ongoing and won't be decided for hours if not days. Many mail in ballots will need to be counted, not to mention ballots from overseas or even service members serving overseas. This may not please the GOP as they want everything today but unfortunately it doesn't work that way. As of this writing the winner of this election is yet to be announced. Please note that the election has been decided in Trump's favor. President-elect Trump won with 277 electoral votes versus Kamels Harris' 224.
Author

Nick Mastrandrea
Market Tea Leaves


