ECB lowers

USD: Jun '25 is Down at 98.010.
Energies: Jun '25 Crude is Down at 62.36.
Financials: The Jun '25 30 Year T-Bond is Lower by 22 ticks and trading at 113.28.
Indices: The Jun '25 S&P 500 emini ES contract is 213 ticks Lower and trading at 5259.50.
Gold: The Jun'25 Gold contract is trading Up at 3406.40.
Initial conclusion
This is not a correlated market. The USD is Down and Crude is Down which is not normal, and the 30 Year T-Bond is trading Lower. The Financials should always correlate with the US dollar such that if the dollar is Higher, then the bonds should follow and vice-versa. The S&P is Lower and Crude is trading Lower which is not correlated. Gold is trading Higher which is correlated with the US dollar trading Down. I tend to believe that Gold has an inverse relationship with the US Dollar as when the US Dollar is down, Gold tends to rise in value and vice-versa. Think of it as a seesaw, when one is up the other should be down. I point this out to you to make you aware that when we don't have a correlated market, it means something is wrong. As traders you need to be aware of this and proceed with your eyes wide open. Asia traded Higher with the exception of the Shanghai and Ausie exchanges. All of Europe is trading Lower with the exception of the London exchange which is fractionally Higher.
Possible challenges to traders
- FOMC Member Goolsbee Speaks at 8:30 AM EST. This is Major.
- CB Leading Index m/m is out at 10 AM EST. This is Major.
Traders, please note that we've changed the Bond instrument from the 10 Year (ZN) to the 2 Year (ZT). They work exactly the same.
We've elected to switch gears a bit and show correlation between the 2-year Treasury notes (ZT) and the S&P futures contract. The YM contract is the Dow Jones Industrial Average, and the purpose is to show reverse correlation between the two instruments. Remember it's likened to a seesaw, when up goes up the other should go down and vice versa.
Last Thursday the ZT climbed Higher at around 8:30 AM EST while awaiting Unemployment Claims. The Dow slid Lower at the same time. Look at the charts below and you'll see a pattern for both assets. The Dow moved Lower at 8:30 AM EST and the ZT moved Higher at around the same time. These charts represent the newest version of Bar Charts, and I've changed the timeframe to a 15-minute chart to display better. This represented a Long opportunity on the 2-year note, as a trader you could have netted 20 plus ticks per contract on this trade. Each tick is worth $6.25. Please note: the front month for ZT is now Jun '25 and the Dow is Jun '25 as well. I've changed the format to filled Candlesticks (not hollow) such that it may be more apparent and visible.
Charts courtesy of barcharts

ZT -Jun 2025 - 4/17/25
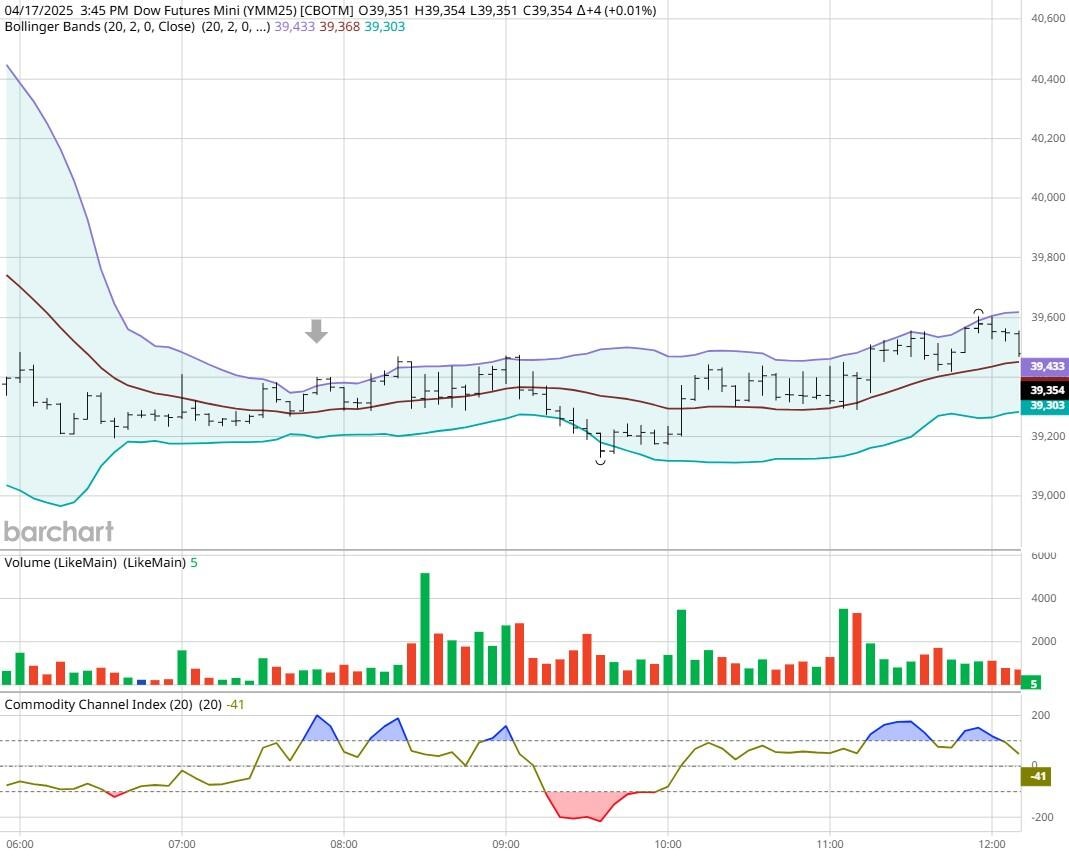
Dow - Mar 2025- 4/17/25
Bias
Last Thursday we gave the markets an Upside bias but only the S&P traded to the Upside and didn't gain much. The S&P advanced only 20 points but the other indices lost ground. Today we aren't dealing with a correlated market, and our bias is Neutral or Mixed.
Could this change? Of Course. Remember anything can happen in a volatile market.
Commentary
So last Thursday the markets were correlated to the Upside yet only the S&P advanced as the other indices lost ground. So, what happened? The European Central Bank decided to cut interest rates, and our administration went ballistic as Trump issued insults against Fed Chair Powell complaining that he was last and not forward enough in terms of rate reductions. I would agree that the Federal Reserve should cut rates to ensure continued consumer spending, but Powell won't do that until he has to and btw he didn't issue tariffs against allies as he knows it will create inflation.
Author

Nick Mastrandrea
Market Tea Leaves


