Dow up, others down
USD: Sept '24 is Up at 105.295.
Energies: Jul '24 Crude is Down at 81.08.
Financials: The Sept '24 30 Year T-Bond is Up 13 ticks and trading at 120.13.
Indices: The Sept '24 S&P 500 emini ES contract is 27 ticks Higher and trading at 5523.75.
Gold: The Aug'24 Gold contract is trading Down at 2342.00
Initial conclusion
This is not a correlated market. The USD is Up and Crude is Down which is normal, and the 30 Year T-Bond is trading Up. The Financials should always correlate with the US dollar such that if the dollar is Higher, then the bonds should follow and vice-versa. The S&P is Higher and Crude is trading Lower which is correlated. Gold is trading Lower which is correlated with the US dollar trading Up. I tend to believe that Gold has an inverse relationship with the US Dollar as when the US Dollar is down, Gold tends to rise in value and vice-versa. Think of it as a seesaw, when one is up the other should be down. I point this out to you to make you aware that when we don't have a correlated market, it means something is wrong. As traders you need to be aware of this and proceed with your eyes wide open. Asia traded Higher with the exception of the Shanghai exchange. Currently all of Europe is trading Lower.
Possible challenges to traders
-
FOMC Member Bowman Speaks at 7 AM EST. This is Major.
-
S&P/CS Composite-20 HPI y/y is out at 9 AM EST. This is Major.
-
HPI m/m is out at 9 AM EST. This is Major.
-
CB Consumer Confidence is out at 10 AM EST. This is Major.
-
Richmond Manufacturing Index is out at 10 AM EST. This is Major.
-
FOMC Member Cook Speaks at 12 noon. This is Major.
-
FOMC Member Bowman Speaks at 2:10 PM EST. This is Major.
Traders, please note that we've changed the Bond instrument from the 10 year (ZN) to the 2 year (ZT). They work exactly the same.
We've elected to switch gears a bit and show correlation between the 10-year Treasury notes (ZN) and the S&P futures contract. The YM contract is the Dow Jones Industrial Average, and the purpose is to show reverse correlation between the two instruments. Remember it's likened to a seesaw, when up goes up the other should go down and vice versa.
Yesterday the ZT migrated Higher at around 8:30 AM EST with no economic news in sight. If you look at the charts below the ZT gave a signal at around 8:30 AM and started its Upward climb. Look at the charts below and you'll see a pattern for both assets. The Dow moved Lower at around 8:30 AM and the ZT moved Higher at around the same time. These charts represent the newest version of BarCharts and I've changed the timeframe to a 15-minute chart to display better. This represented a Long opportunity on the 2-year note, as a trader you could have netted about a dozen ticks per contract on this trade. Each tick is worth $7.625. Please note: the front month for ZT is Sept and the Dow is now Sept '24. I've changed the format to filled Candlesticks (not hollow) such that it may be more apparent and visible.
Charts courtesy of barcharts
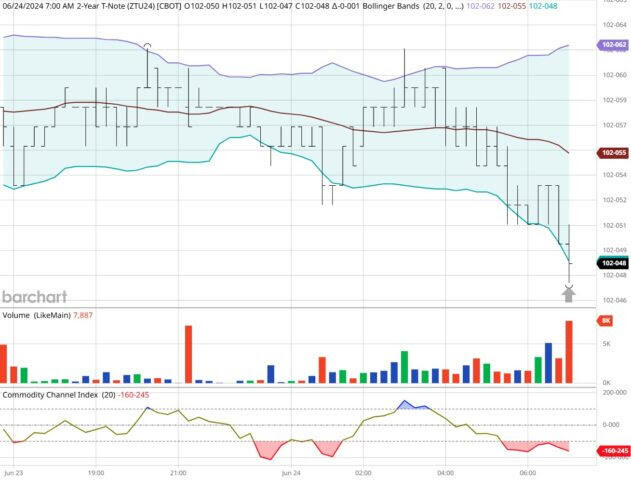
ZT -Sept 2024 - 06/24/24
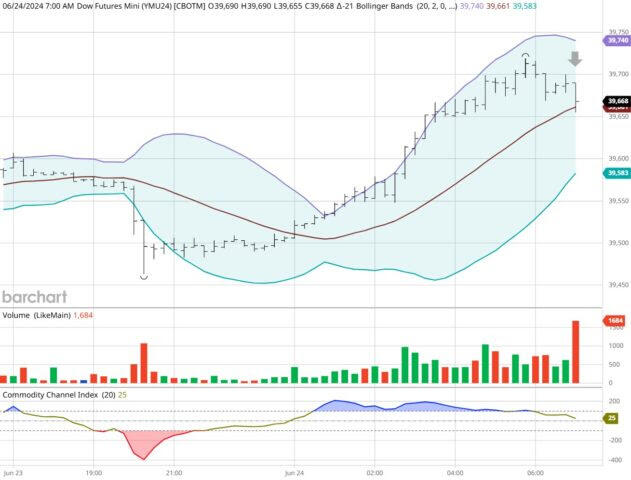
Dow - Sept 2024 - 06/24/24
Bias
Yesterday, we gave the markets am Upside bias as both the USD and the Bonds were Higher Monday morning and that usually reflects an Upside Day. The Dow did close Higher by 261 points, the other indices traded Lower on the session. Today we aren't dealing with a correlated market and our bias is Mixed or Neutral.
Could this change? Of Course. Remember anything can happen in a volatile market.
Commentary
Yesterday the only economic news we had was an FOMC member speaking at 2 PM Monday afternoon. We didn't have much of a market change after this member spoke. Today we have more in the way of economic news as we have Home Price Index and Richmond Manufacturing Index numbers. Home Price Index is especially major as real estate is still a viable asset in the US economy. Unfortunately, it would be great if our all wise and all-knowing Federal Reserve understood that and decided to start lowering rates. Then perhaps more people could start buying homes and really boost the US economy. Perhaps "Uncle Joe" Biden could talk to these people and enlighten them but personally I don't think he has the guts for it.
Author

Nick Mastrandrea
Market Tea Leaves


