Dow down again [Video]
![Dow down again [Video]](https://editorial.fxstreet.com/images/Markets/Equities/DowJones/dow-jones-industrial-average-on-iphone-19534758_XtraLarge.jpg)
US Dollar: Mar '23 USD is Down at 105.285.
Energies: Apr '23 Crude is Up at 76.71.
Financials: The Jun '23 30 Year T-Bond is Down 10 ticks and trading at 125.01.
Indices: The Mar '23 S&P 500 emini ES contract is 34 ticks Lower and trading at 3986.50.
Gold: The Apr'23 Gold contract is trading Up at 1823.10. Gold is 45 ticks Higher than its close.
Initial conclusion
This is not a correlated market. The dollar is Down, and Crude is Up which is normal, and the 30 Year T-Bond is trading Lower. The Financials should always correlate with the US dollar such that if the dollar is Higher, then the bonds should follow and vice-versa. The S&P is Lower, and Crude is trading Higher which is correlated. Gold is trading Higher which is correlated with the US dollar trading Down. I tend to believe that Gold has an inverse relationship with the US Dollar as when the US Dollar is down, Gold tends to rise in value and vice-versa. Think of it as a seesaw, when one is up the other should be down. I point this out to you to make you aware that when we don't have a correlated market, it means something is wrong. As traders you need to be aware of this and proceed with your eyes wide open. At the present time all of Asia is trading mainly Lower with the exception of the Nikkei and Aussie exchanges. Currently all of Europe is trading Lower.
Possible challenges to traders today
-
Challenger Job Cuts y/y is out at 7:30 AM EST. Major.
-
Unemployment Claims is out at 8:30 AM EST. Major.
-
FOMC Member Barr Speaks at 10 AM EST. Major.
-
Natural Gas Storage is out at 10:30 AM EST. Major.
-
30-y Bond Auction is out at 1 PM EST. Major.
Treasuries
Traders, please note that we've changed the Bond instrument from the 30 year (ZB) to the 10 year (ZN). They work exactly the same.
We've elected to switch gears a bit and show correlation between the 10-year bond (ZN) and the S&P futures contract. The S&P contract is the Standard and Poor's, and the purpose is to show reverse correlation between the two instruments. Remember it's likened to a seesaw, when up goes up the other should go down and vice versa.
Yesterday the ZN hit a Low at around 10 AM EST. The S&P was trading Higher at around the same time. If you look at the charts below ZN gave a signal at around 10 AM and the S&P gave a signal at around the same time. Look at the charts below and you'll see a pattern for both assets. ZN hit a Low at around 10 AM and migrated Higher. These charts represent the newest version of MultiCharts and I've changed the timeframe to a 15-minute chart to display better. This represented a Long opportunity on the 10-year note, as a trader you could have netted about a 20 plus ticks per contract on this trade. Each tick is worth $15.625. Please note: the front month for the ZN is now Jun '23. The S&P contract is still Mar' 23. I've changed the format to filled Candlesticks (not hollow) such that it may be more apparent and visible.
Charts courtesy of MultiCharts built on an AMP platform
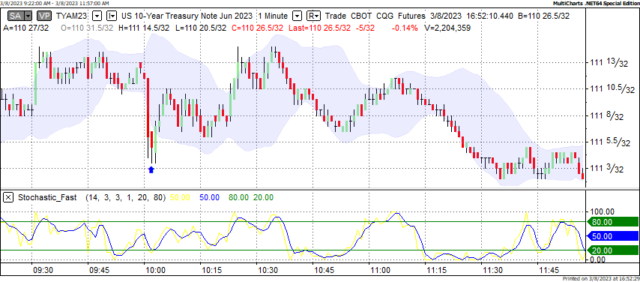
ZN - Jun 2023 - 3/08/23
-638139605471031455.png)
S&P - Mar 2023 - 3/08/23
Bias
Yesterday we gave the markets a Neutral or Mixed bias as we didn't see any semblance of market correlation hence the Neutral bias. The markets traded Mixed with the Dow down 58 points but the S&P and Nasdaq both closed in Higher territory. Today we aren't dealing with a correlated market and our bias is Neutral.
Could this change? Of Course. Remember anything can happen in a volatile market.
Commentary
Yesterday the markets showed no semblance of correlation as the instruments we use for Market Correlation purposes were all over the map, so to speak. At 10 AM ESTY Fed Chair Powell for the second day in a row testified before a Congressional Committee and this drove the markets Lower. He wasn't as hawkish yesterday as he was on Tuesday, so the markets didn't fall a cliff. The Dow did trade Lower but only by 58 points and the other did manage to gain some ground. Today we have Challenger Job Cuts and Unemployment Claims which will dovetail nicely in tomorrow's Non-Farm Payrolls report.
Author

Nick Mastrandrea
Market Tea Leaves


