Market insight: Gold and USD rise, indices fall – Key data releases ahead

USD: Dec '24 is Down at 103.995.
Energies: Nov '24 Crude is Up at 71.40.
Financials: The Dec '24 30 Year T-Bond is Up 25 ticks and trading at 118.26.
Indices: The Dec '24 S&P 500 emini ES contract is 104 ticks Higher and trading at 5865.00.
Gold: The Dec'24 Gold contract is trading Up at 2750.10.
Initial conclusion
This is not a correlated market. The USD is Down and Crude is Up which is normal, but the 30 Year T-Bond is trading Higher. The Financials should always correlate with the US dollar such that if the dollar is Higher, then the bonds should follow and vice-versa. The S&P is Higher and Crude is trading Higher which is not correlated. Gold is trading Higher which is correlated with the US dollar trading Down. I tend to believe that Gold has an inverse relationship with the US Dollar as when the US Dollar is down, Gold tends to rise in value and vice-versa. Think of it as a seesaw, when one is up the other should be down. I point this out to you to make you aware that when we don't have a correlated market, it means something is wrong. As traders you need to be aware of this and proceed with your eyes wide open. Asia traded Lower with the Nikkei and Singapore exchanges Higher. All of Europe is trading Higher.
Possible challenges to traders
-
Unemployment Claims are out at 8:30 AM EST. This is Major.
-
FOMC Member Hammack Speaks at 8:45 AM EST. This is Major.
-
Flash Manufacturing PMI is out at 9:45 AM EST. This is Major.
-
Flash Services PMI is out at 9:45 AM EST. This is Major.
-
New Home Sales are out at 10 AM EST. This is Major.
-
Natural Gas Storage is out at 10:30 AM EST. This is Major.
Traders, please note that we've changed the Bond instrument from the 10 year (ZN) to the 2 year (ZT). They work exactly the same.
We've elected to switch gears a bit and show correlation between the 2-year Treasury notes (ZT) and the S&P futures contract. The YM contract is the Dow Jones Industrial Average, and the purpose is to show reverse correlation between the two instruments. Remember it's likened to a seesaw, when up goes up the other should go down and vice versa.
Yesterday the ZT migrated Higher at around 7:30 AM EST with no real economic reports at the same time and began its Upward climb. Look at the charts below and you'll see a pattern for both assets. The Dow moved Higher at 7:30 AM and the ZT moved Lower at around the same time. These charts represent the newest version of Bar Charts, and I've changed the timeframe to a 15-minute chart to display better. This represented a Short opportunity on the 2-year note, as a trader you could have netted about 20 ticks per contract on this trade. Each tick is worth $7.625. Please note: the front month for ZT is Dec and the Dow is now Dec '24. I've changed the format to filled Candlesticks (not hollow) such that it may be more apparent and visible.
Charts courtesy of Barcharts
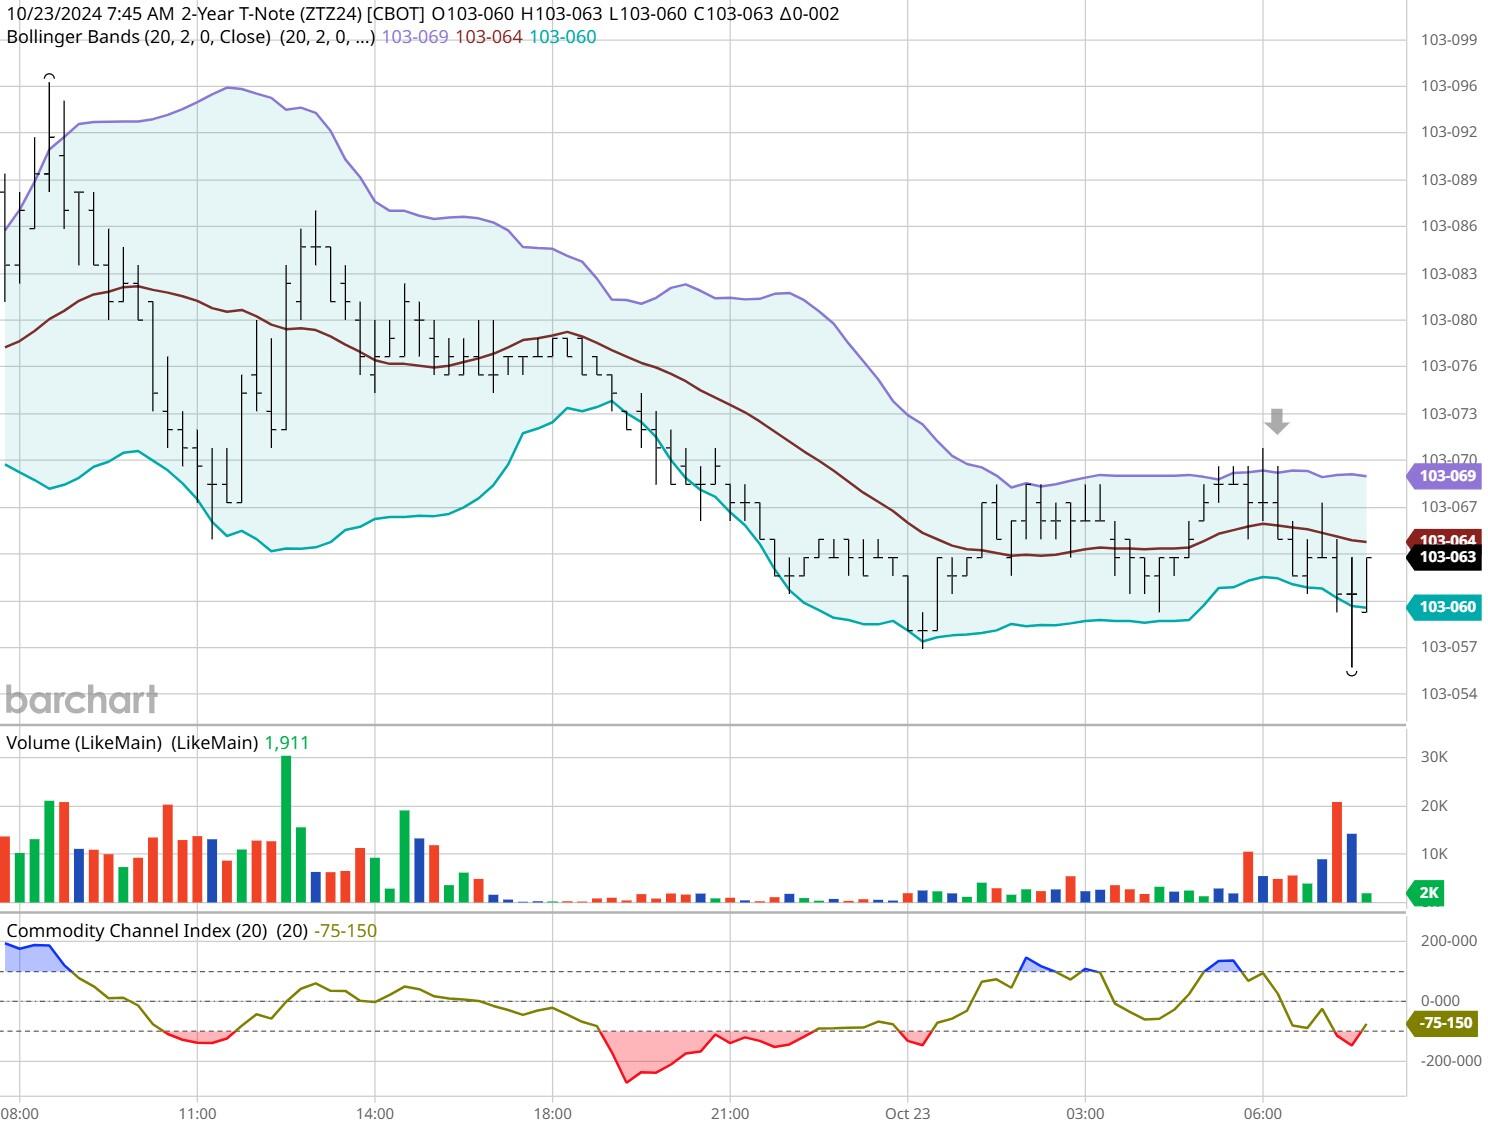
ZT -Dec 2024 - 10/23/24
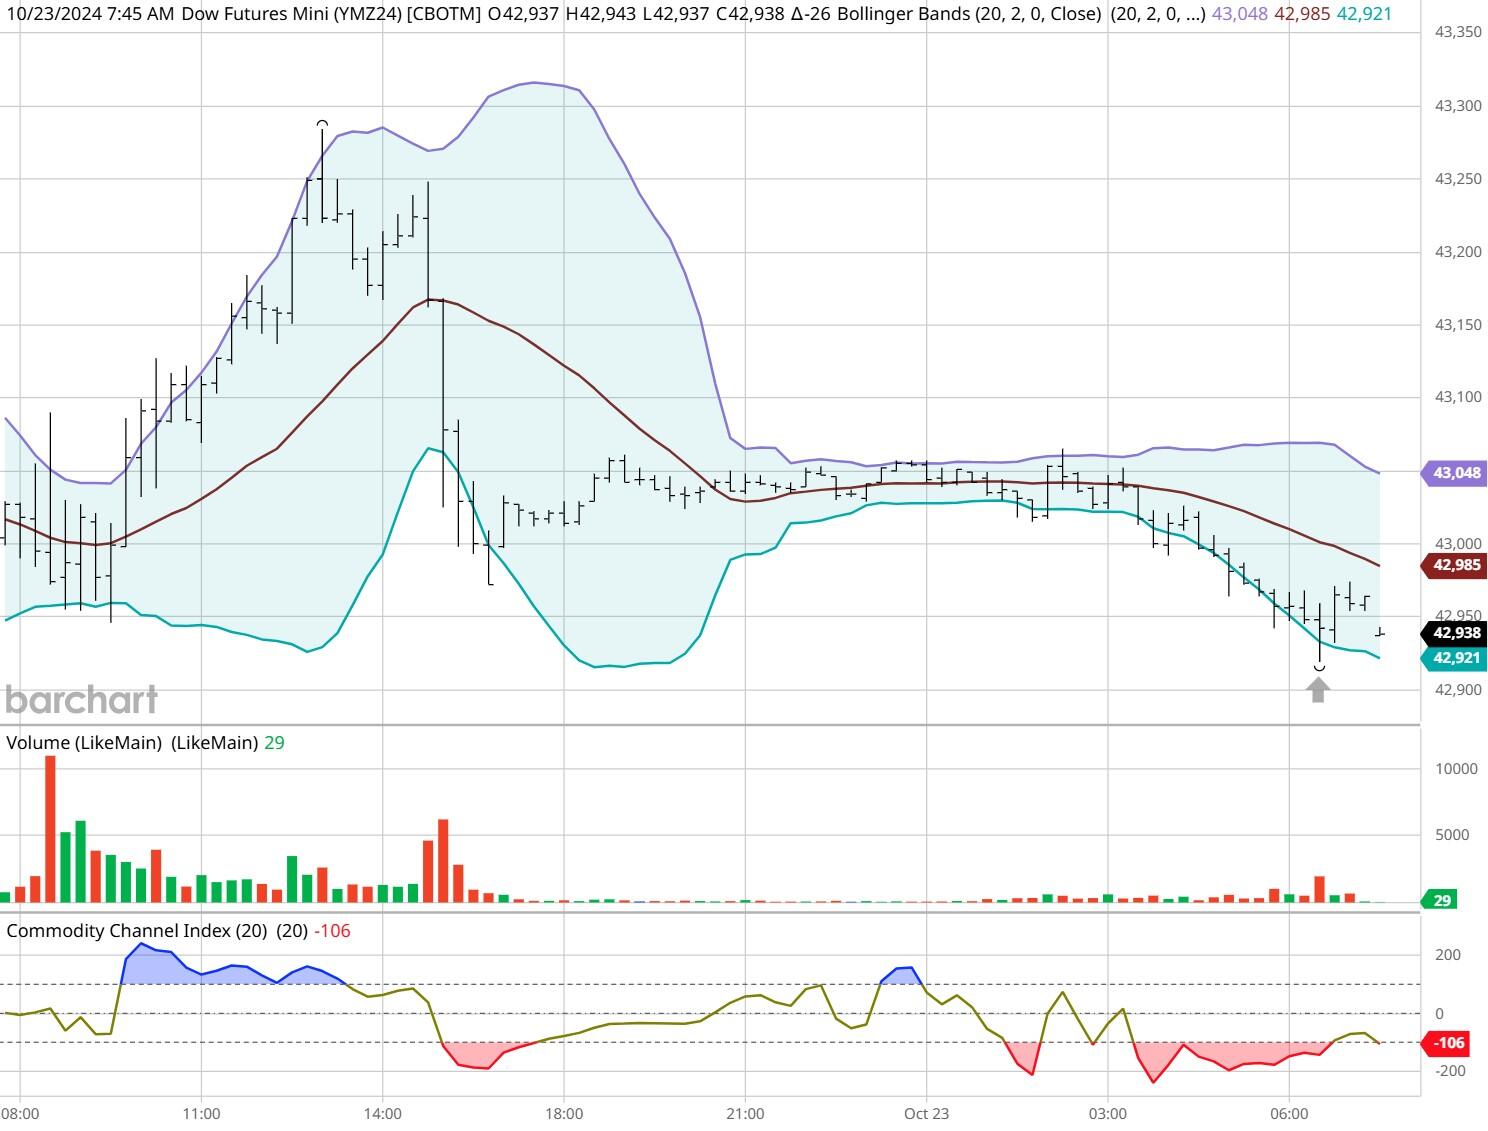
Dow - Dec 2024- 10/23/24
Bias
Yesterday we gave the markets a Downside bias as the USD and Gold were trading Higher Wednesday morning and the indices were all pointed Lower. The markets didn't disappoint as the Dow traded Lower by 410 points and the other indices traded Lower as well. Today we aren't dealing with a correlated market, and our bias is Neutral or Mixed.
Could this change? Of Course. Remember anything can happen in a volatile market.
Commentary
So, Wednesday comes, and Gold and the USD were all trading Higher. This to us was a clear indication for a Downside Day especially given the fact that two of the three instruments we use for market correlation purposes were all trading Higher. The markets didn't disappoint as all the indices closed Lower yesterday. Today we have Unemployment Claims, New Home Sales and PMI numbers; all of which are Major.
Author

Nick Mastrandrea
Market Tea Leaves


