Dollar’s possible breakout and its major implications

After moving to its Fibonacci-extension-based target, gold price declined – so far, just modestly so.
Gold's rising wedge breaks: A bearish indicator
“So far” is the most important part of the above sentence. Perhaps writing “yet” would be even better. The yellow metal moved lower after touching its upside price target, which means that the decline we see right now is likely more than just regular profit-taking action.
As a reminder, in yesterday’s analysis (entitled Gold Price Forecast for October 2024), I wrote the following:
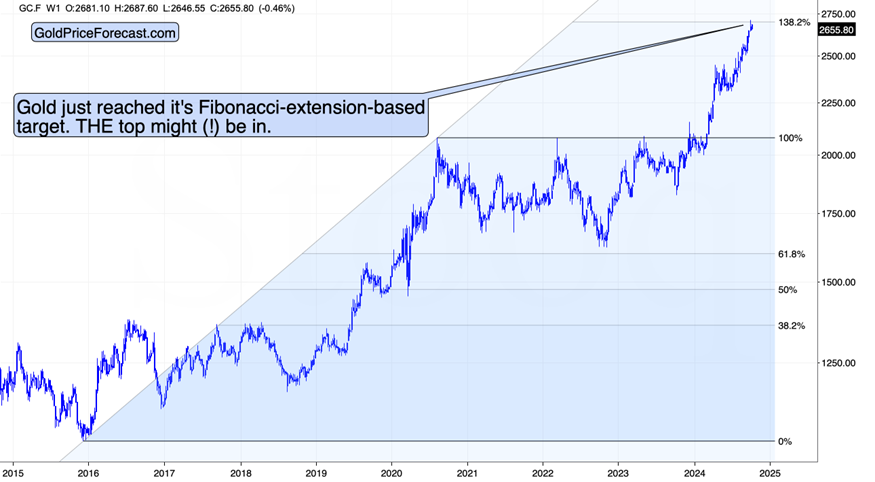
The tops were connected to the Fibonacci tool very precisely and it turns out that gold not only reached its upside target, but it even moved slightly above it, and then moved back down in a clear manner.
Gold even formed a weekly shooting star candlestick, which is a reversal sign. We saw this candlestick previously and it was able to generate just a small move lower then, but this time IS different, precisely because of the target that was reached.
On a short-term basis, we see that gold invalidated its move above the upper border of the rising wedge pattern.
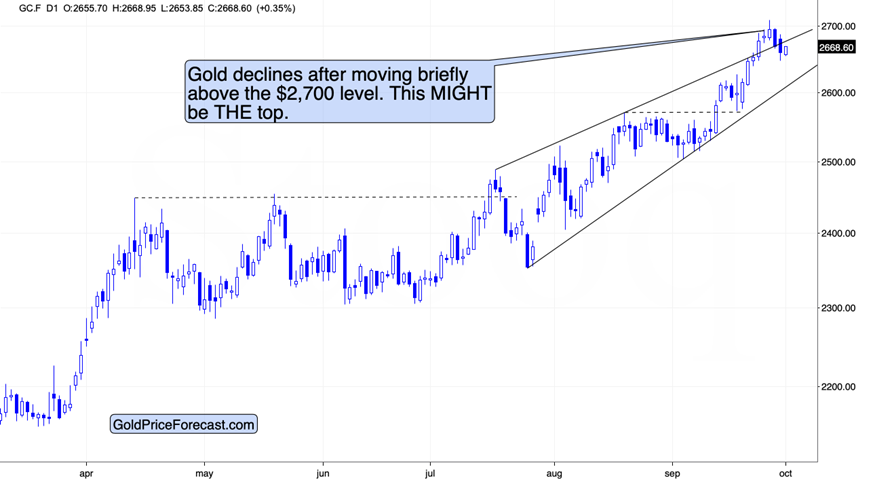
That’s a sell sign, but a move below the lower border (currently close to $2,600) will serve as an even more important confirmation. And yes, we are likely to see it – especially given the very tense situation on the USD Index chart.
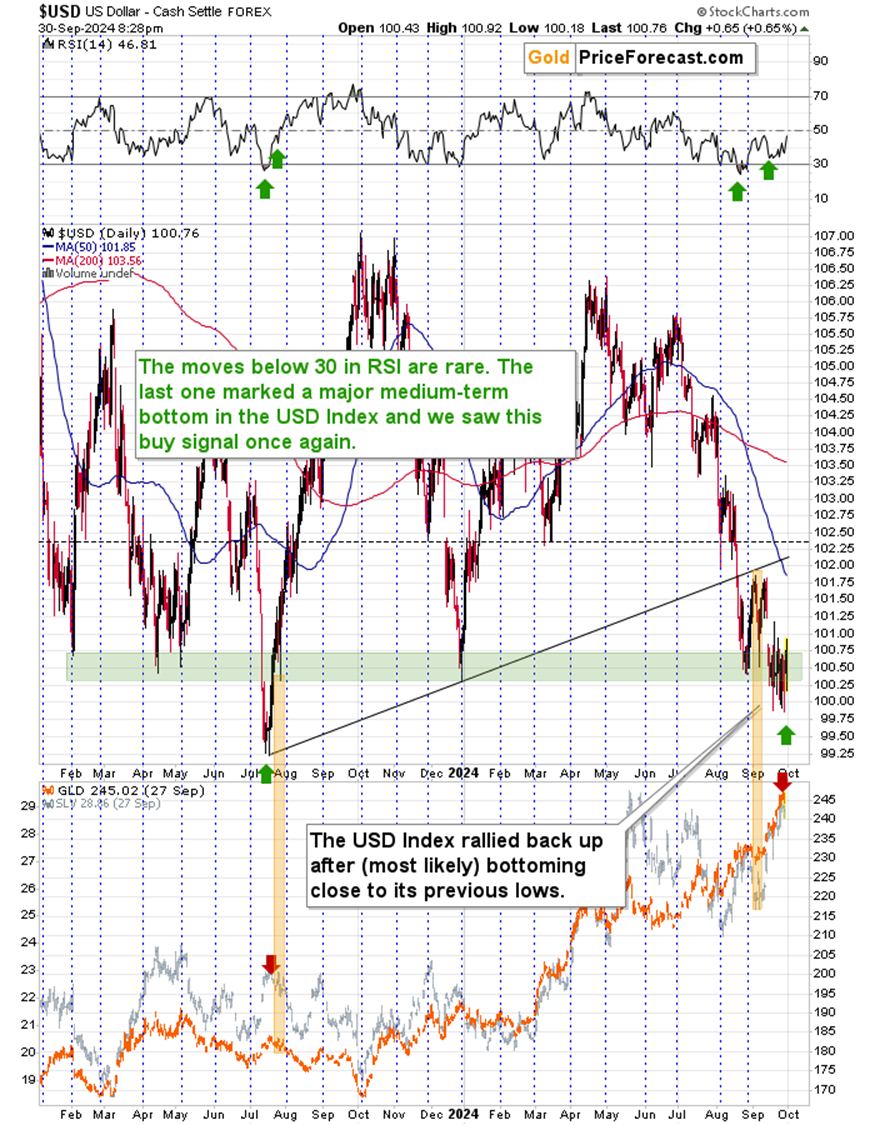
The USD Index is moving back and forth, below and back above the previous lows. It breaks below them and then quickly invalidates the breakdown. The bulls are simply too powerful here to allow for a breakdown.
And you know what? It seems this is about to end, and a rally will likely follow.
One of the reasons is the USD Index’s tendency to reverse its course close to the turn of the month (or right at it). I marked those turnarounds with vertical, dashed lines. And, well, the turn of the month is upon us.
Undoubtedly, the most recent move in the USD Index was to the downside, so the above tendency is likely to have bullish implications.
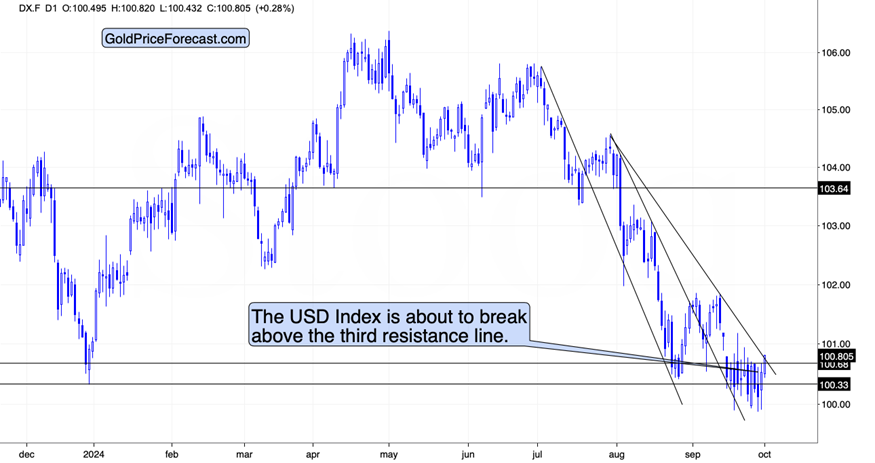
Another thing is that a move higher from here would likely lead to a breakout above the USD’s declining resistance line. This is particularly important because of the “three line break” technique.
The latter means that it is the third breakout – above the third resistance line that really matters. As you can see on the above chart – THIS is the third line. So, yes, the implications are likely to be profound.
At the moment of writing these words, the USD Index moved slightly above the third resistance line – perhaps we are witnessing the breakout right now.
Since the precious metals market tends to move in the opposite direction to the direction in which the USD Index is moving, the above is likely to add fuel to the bearish fire in gold, silver, and – perhaps most importantly – mining stocks.
GDXJ confirms sell signal
And speaking of mining stocks – they just provided us with a particularly meaningful sell signal.
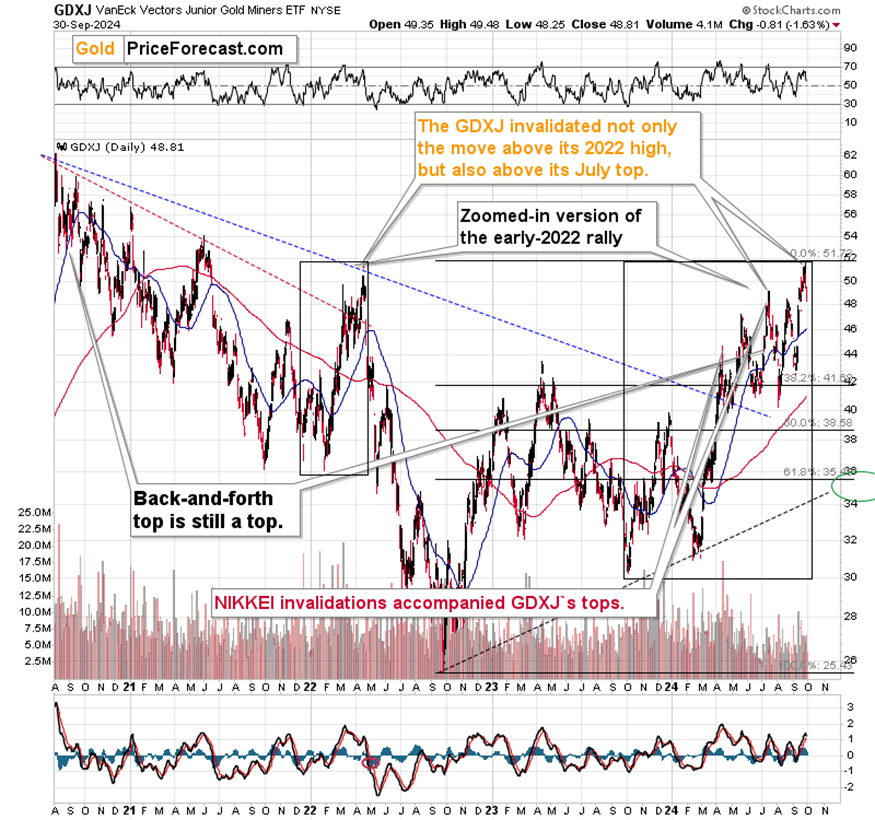
The GDXJ just declined, which is nothing special on its own (no wonder gold declined as well), but it is very important in terms of what kind of price move was just invalidated.
I previously wrote that the breakout above the 2022 top was invalidated – this was the critical sell signal. Yesterday, however, we saw another confirmation of this signal. Namely, the GDXJ invalidated its move above its July top.
With both breakouts being invalidated, the next move will likely be to the downside. This, of course, perfectly fits what we see on gold and USD Index charts.
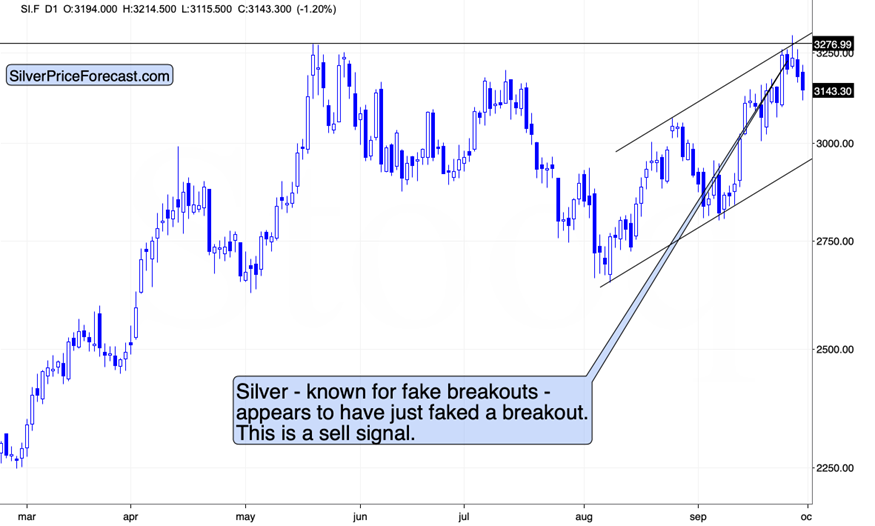
Silver declined as well, shortly after its “fake out”. The next step for the white metal is most likely an invalidation of the move above $30 – all previous attempts to move above $30 (in the recent years) were invalidated, and this one is not likely to be any different.
Yes, this creates a superb trading opportunity. Yes, it’s very difficult to be positioned against the overwhelming bullishness. And yes, what’s particularly difficult in trading and investing, is quite often the right thing to do. Of course, I can’t guarantee any kind of performance on any trade, but it does seem to me that this move lower is THE one that you nobody wants to miss.
Want free follow-ups to the above article and details not available to 99%+ investors? Sign up to our free newsletter today!
Want free follow-ups to the above article and details not available to 99%+ investors? Sign up to our free newsletter today!
Author

Przemyslaw Radomski, CFA
Sunshine Profits
Przemyslaw Radomski, CFA (PR) is a precious metals investor and analyst who takes advantage of the emotionality on the markets, and invites you to do the same. His company, Sunshine Profits, publishes analytical software that any


