Dollar Weekly Forecast: DXY supported by Fed rate cuts' hopes
- The US Dollar kept a side-line mood over the last week.
- The positive surprise in US CPI did nothing to affect rate cuts.
- Markets’ attention now shifts to results from key data releases.

The greenback, when tracked by the USD Index (DXY), gave away part of the gains recorded at the auspicious start of the new trading year, managing well to survive just above the 102.00 support throughout a volatile week.
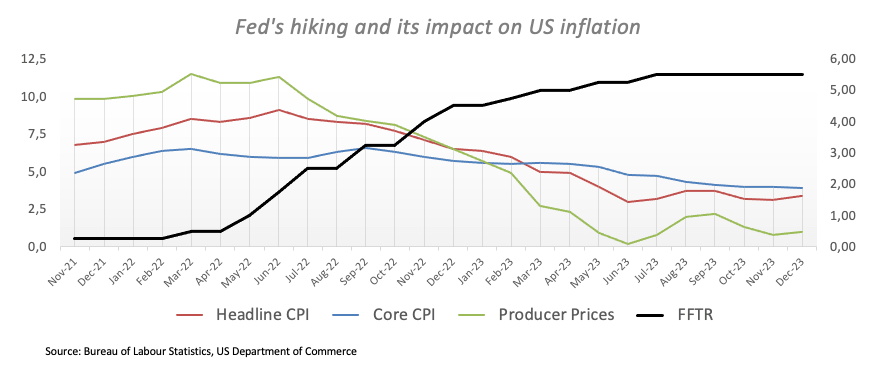
In fact, the US Dollar (USD) traded mostly within a consolidative range during the week, along with the equally directionless pattern of US yields across different timeframes, while speculation has been building ahead of the release of the most-watched US inflation figures tracked by the Consumer Price Index (CPI) on January 11. Once the CPI came out, it surprisingly showed an uptick in the evolution of consumer prices on a yearly basis in the last month of 2023, which in turn morphed into an initial jump in the index to the 102.80 zone, although that move fizzled out with the hours and in tandem with pretty-much-unchanged expectations of an interest rate cut by the Federal Reserve as soon as March.
So far, and according to CME Group’s FedWatch Tool, the probability of that scenario hovers around 80%, up from nearly 65% a week ago.
Despite the Fed being perceived as one of the first major central banks to start trimming its reference interest rates when compared to the likes of the European Central Bank (ECB), the Bank of England (BoE), and the Reserve Bank of Australia (RBA), a firm decline in the Greenback is not a done deal, particularly in light of the increasingly resilient US economy (largely probed by solid fundamentals in the past months), which reaches its highest point when one looks at the unabated tightness of the labour market.
Moving forward into the next week, the data-dependent stance of the Fed will be put to the test once again with the key releases of Retail Sales, Industrial Production, weekly Initial Jobless Claims, the Philly Fed manufacturing gauge, preliminary Consumer Sentiment and housing sector readings.
DXY daily chart
DXY Technical Outlook
Looking at the daily chart, the DXY index is expected to face immediate resistance at the so-far yearly high of 103.10 (January 5) just ahead of the critical 200-day SMA at 103.42, a region also coincident with the transitory 55-day SMA. Further north aligns the December top of 104.26 (December 8,11), just before the interim 100-day SMA at 104.41. The surpassing of the latter should pave the way for the November peak of 107.11 (November 1) once the minor up-barrier at the weekly high of 106.10 is cleared (November 10).
In case sellers regain the upper hand and force DXY to breach the ongoing consolidative phase, there is no contention zone of note until the December low of 100.61 (December 28). In case this region is breached, the index might embark on a downward path to the 2023 bottom of 99.57 (July 14), always bearing in mind that the psychological 100.00 yardstick does not hold.
Of note: The downtrend in the day-to-day RSI is consistent with the current rangebound trade and could even allow for some near-term weakness.
US Dollar price today
The table below shows the percentage change of US Dollar (USD) against listed major currencies today. US Dollar was the strongest against the .
| USD | EUR | GBP | CAD | AUD | JPY | NZD | CHF | |
| USD | 0.24% | 0.29% | 0.18% | 0.16% | -0.06% | -0.04% | 0.24% | |
| EUR | -0.25% | 0.03% | -0.08% | -0.11% | -0.33% | -0.32% | -0.01% | |
| GBP | -0.30% | -0.06% | -0.12% | -0.15% | -0.36% | -0.36% | -0.05% | |
| CAD | -0.18% | 0.05% | 0.10% | -0.04% | -0.25% | -0.22% | 0.04% | |
| AUD | -0.16% | 0.09% | 0.12% | 0.02% | -0.23% | -0.22% | 0.08% | |
| JPY | 0.07% | 0.30% | 0.37% | 0.23% | 0.25% | 0.03% | 0.31% | |
| NZD | 0.04% | 0.31% | 0.34% | 0.24% | 0.22% | -0.01% | 0.29% | |
| CHF | -0.24% | 0.00% | 0.05% | -0.06% | -0.06% | -0.30% | -0.27% |
The heat map shows percentage changes of major currencies against each other. The base currency is picked from the left column, while the quote currency is picked from the top row. For example, if you pick the Euro from the left column and move along the horizontal line to the Japanese Yen, the percentage change displayed in the box will represent EUR (base)/JPY (quote).
Premium
You have reached your limit of 3 free articles for this month.
Start your subscription and get access to all our original articles.
Author

Pablo Piovano
FXStreet
Born and bred in Argentina, Pablo has been carrying on with his passion for FX markets and trading since his first college years.


