Dollar Weekly Forecast: The Fed will rule the sentiment next week
- The USD Index (DXY) kept a side-lined theme this week.
- US yields traded in a mixed fashion ahead of the Fed meeting.
- Investors now see a May rate cut as more likely.
In line with most of the FX universe, the Greenback navigated choppy waters this past week around the 103.20 zone when tracked by the USD Index (DXY).
A rate cut in March now seems off the table
As usual in past sessions, firmer-than-estimated results from key US fundamentals maintained a generally constructive view on the US Dollar this week.
In fact, encouraging readings from Retail Sales, flash Q4 GDP Growth Rate and the Trade Balance have all lent support to the idea that the first interest rate cut by the Federal Reserve intended for the month of March could now seem somewhat premature.
On the latter, the probability of a rate reduction in March shrank to around 45% when measured by CME Group’s FedWatch Tool vs. an increase to nearly 52% corresponding to May.
This unabated resilience of the US economy reinforced the increasing case for a “soft landing”. Coupled with the pick-up in CPI inflation figures in the last month of 2023 and the persevering strength of the domestic labour market all prompted Fed officials to start playing in favour of an interest rate cut, but later than anticipated, something that still appears at odds with investors’ belief.
The Fed now comes to the fore
FOMC Governor Chris Waller stated earlier in the month that the timing of interest rate cuts this year will depend on discussions within the Fed policy-setting panel. He emphasized that he would prefer not to initiate cuts until they were "reasonably convinced" that inflation had consistently approached the Fed's 2% target.
Similarly, his counterpart at the Atlanta Fed, Raphael Bostic, indicated a readiness to contemplate implementing interest rate reductions prior to July if there is "compelling" evidence of inflation slowing down more rapidly than initially anticipated. While reiterating the plan to commence rate cuts in the third quarter, he underscored the importance of exercising caution to avoid premature reductions that could potentially rekindle demand and inflationary pressure.
While the debate among market participants now seems to have moved to an interest rate cut in March or May, an unchanged decision at the January 31 event appears to be a done deal.
DXY daily chart
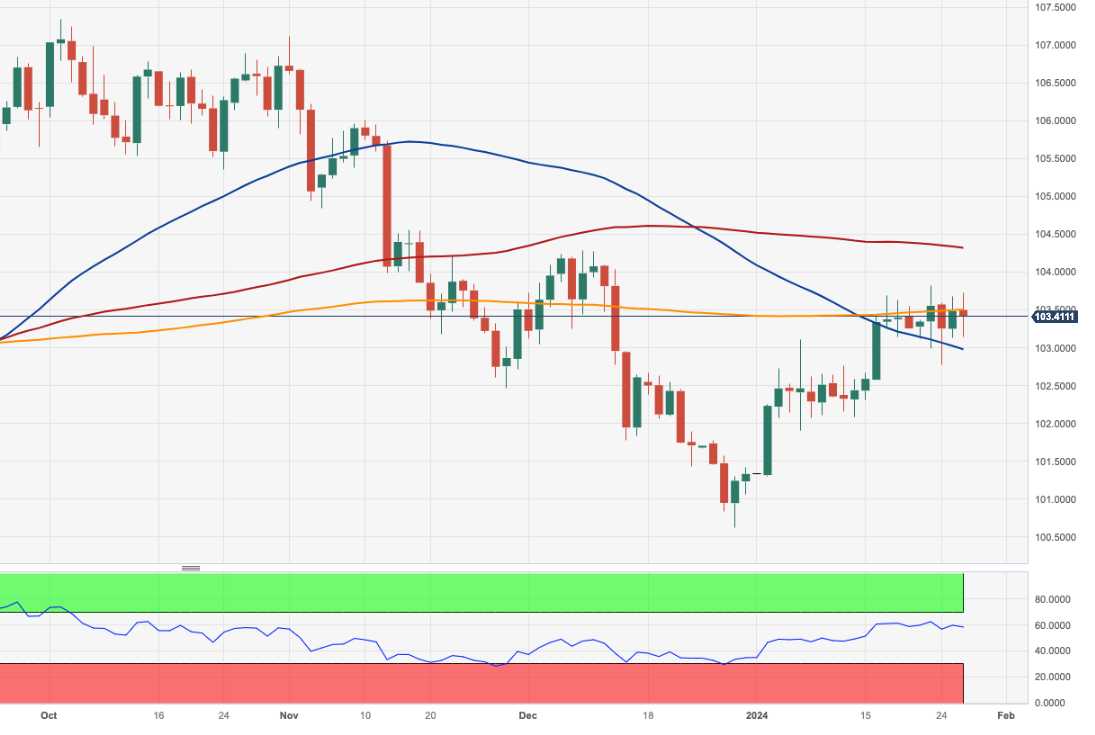
DXY technical outlook
Looking at the daily chart of the DXY index, we can see that immediate resistance is expected around the YTD high of 103.81 (January 23). This level is underpinned by the vicinity of the important 200-day Simple Moving Average (SMA) at 103.49. Further up, we discover the December top of 104.26 (December 8 and 11), right before meeting the transitory 100-day SMA at 104.31. If the index exceeds this level, it might open the way for a rise toward the November top of 107.11 (November 1) after clearing the minor resistance at the weekly high of 106.10. (November 10).
However, if sellers regain the upper hand, there is an initial contention at the weekly low of 102.77 seen on January 24. The loss of this level should see no substantial support zone until the December low of 100.61 (December 28). If this level is crossed, the index may perhaps go on a downward trajectory toward the psychological 100.00 mark before edging lower to the 2023 bottom of 99.57. (July 14).
US Dollar price this week
The table below shows the percentage change of US Dollar (USD) against listed major currencies this week. US Dollar was the weakest against the Swiss Franc.
| USD | EUR | GBP | CAD | AUD | JPY | NZD | CHF | |
| USD | 0.30% | -0.23% | 0.10% | 0.06% | -0.05% | 0.24% | -0.61% | |
| EUR | -0.29% | -0.52% | -0.21% | -0.23% | -0.34% | -0.04% | -0.90% | |
| GBP | 0.23% | 0.53% | 0.33% | 0.30% | 0.18% | 0.48% | -0.37% | |
| CAD | -0.10% | 0.19% | -0.32% | -0.01% | -0.12% | 0.17% | -0.69% | |
| AUD | -0.08% | 0.26% | -0.31% | 0.03% | -0.12% | 0.17% | -0.67% | |
| JPY | 0.05% | 0.32% | -0.14% | 0.13% | 0.12% | 0.32% | -0.57% | |
| NZD | -0.25% | 0.05% | -0.49% | -0.17% | -0.18% | -0.31% | -0.88% | |
| CHF | 0.59% | 0.89% | 0.36% | 0.69% | 0.66% | 0.56% | 0.84% |
The heat map shows percentage changes of major currencies against each other. The base currency is picked from the left column, while the quote currency is picked from the top row. For example, if you pick the Euro from the left column and move along the horizontal line to the Japanese Yen, the percentage change displayed in the box will represent EUR (base)/JPY (quote).
Premium
You have reached your limit of 3 free articles for this month.
Start your subscription and get access to all our original articles.
Author

Pablo Piovano
FXStreet
Born and bred in Argentina, Pablo has been carrying on with his passion for FX markets and trading since his first college years.


