Dollar weakens as the Treasury yield slumps

U.S. long-term treasury yields have retraced to recent lows, adding sparking discussions about the possibility of the Federal Reserve cutting rates next year; this has added downside pressure on the U.S. dollar, with the dollar index reaching its lowest level since August, supporting gold prices to trade firmly above $2000. In contrast, oil prices remain muted in anticipation of the OPEC meeting on November 30th, where uncertainties loom due to the lack of consensus on oil output quotas. Australia's Retail Sales unexpectedly fell, attributed to elevated interest rates dampening consumption. This development may influence the strength of the Aussie dollar, particularly in the context of the upcoming Reserve Bank of Australia's final meeting next week on monetary policy decisions.
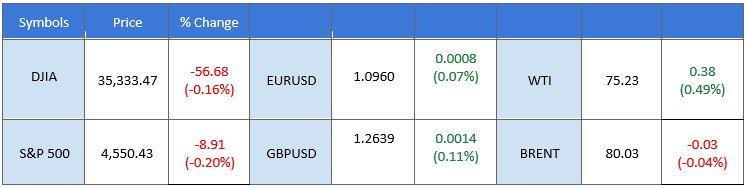
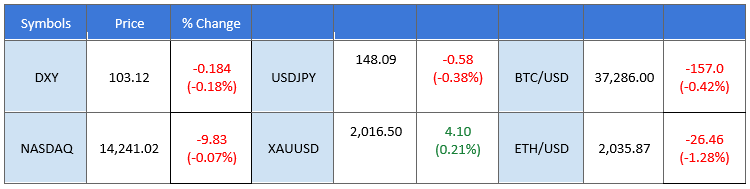
Market overview
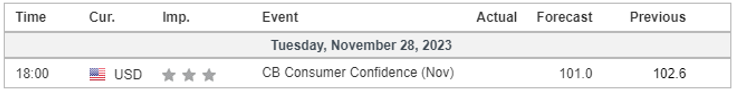
Economic calendar
(MT4 System Time)
Source: MQL5
Market movements
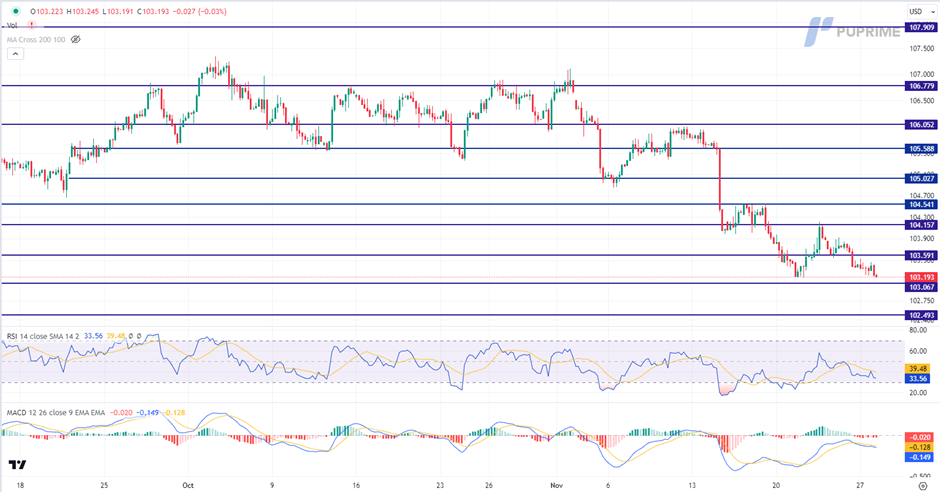
Dollar Index, H4
The Dollar Index, tracking against a basket of major currencies, continued its losses, driven by expectations that the Federal Reserve might pause its tightening monetary policy cycle. Market participants, with a 23% probability according to CME FedWatch Tools, anticipate the Fed could potentially ease monetary policy as early as March. Growing concerns over the economic outlook and stabilized inflation contribute to this sentiment. Investors closely watch economic data, including the Core PCE Price Index, for crucial trading signals.
The Dollar Index is trading lower following the prior retracement from the resistance level. MACD has illustrated increasing bearish momentum, while RSI is at 34, suggesting the index might extend its losses since the RSI stays below the midline.
Resistance level: 103.60, 104.15.
Support level: 103.05, 102.50.
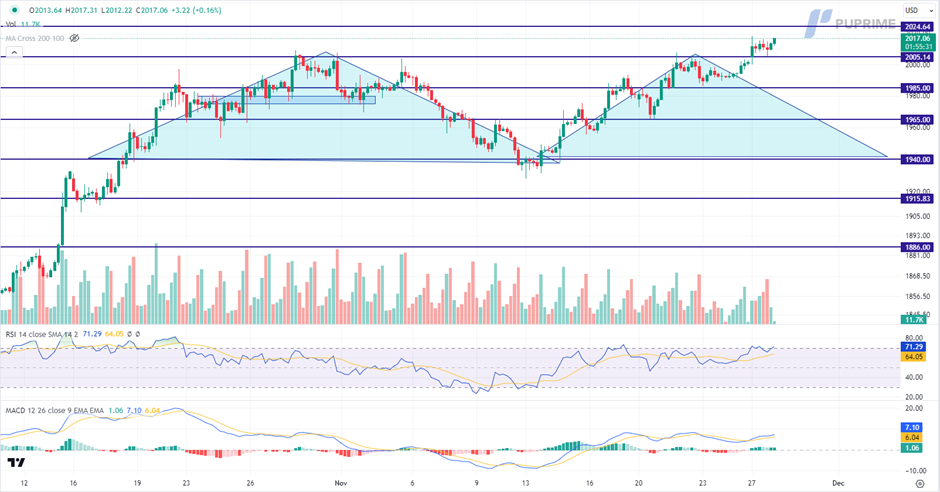
XAU/USD, H4
Gold prices showcase an upward trajectory, gaining momentum after a successful breach of the psychological barrier at $2000. This surge is fueled by heightened investor interest in the safe-haven asset, accentuated by the ongoing depreciation of the US Dollar. With a bleak economic outlook in the United States, accentuated by a series of disappointing economic data, the Federal Reserve faces increasing expectations to consider a pause in its tightening monetary policy. This scenario further supports the appeal of non-yielding assets like gold and silver.
Gold prices are trading higher following the prior breakout above the resistance level. MACD has illustrated increasing bullish momentum. However, RSI is at 71, suggesting the commodity might enter overbought territory.
Resistance level: 2025.00, 2045.00.
Support level: 2005.00, 1985.00.
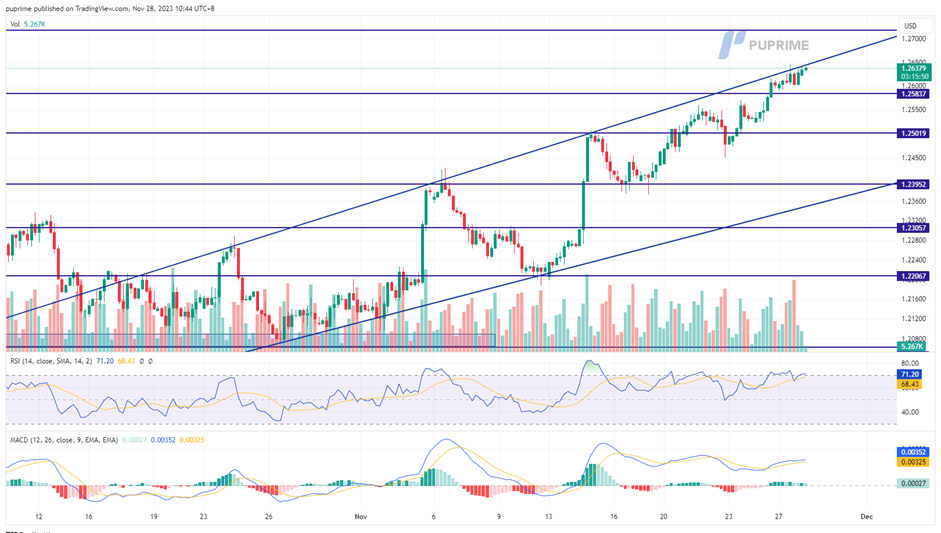
GBP/USD, H4
The British Pound (Sterling) continues its upward trajectory against the U.S. dollar. In contrast, the dollar itself experiences a decline, attributed to the lack of momentum in U.S. long-term treasury yields. The Sterling's bullish momentum is sustained by recent hawkish statements from the Bank of England (BoE), underlining the UK's persistently high inflation. In contrast, market discussions are emerging around the possibility that the Federal Reserve may commence rate cuts next year, adding a layer of uncertainty to the U.S. dollar's outlook.
GBP/USD is trading firmly in an uptrend trajectory. The RSI is hovering close to the overbought zone while the MACD flows above the zero line, suggesting the bullish momentum is still strong.
Resistance level: 1.2710 1.2790.
Support level: 1.2502, 1.2390.
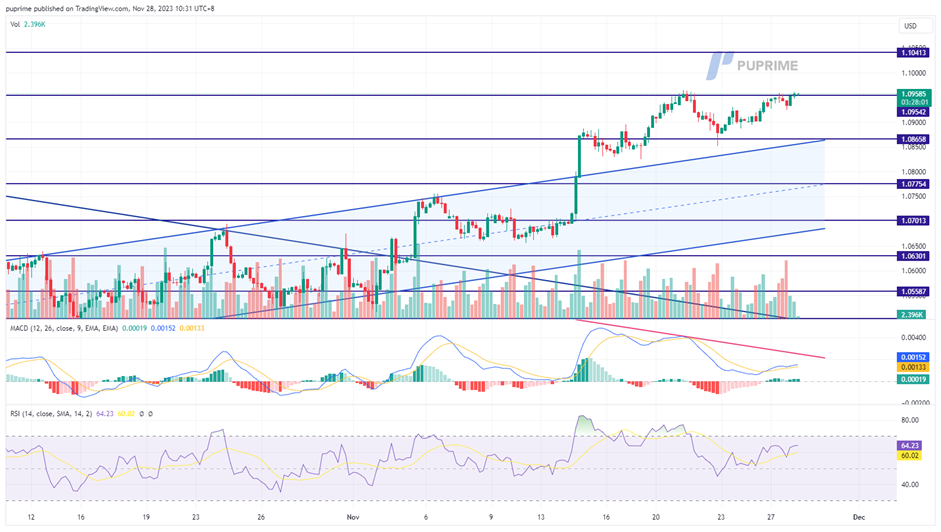
EUR/USD, H4
The Euro experienced marginal gains against the U.S. dollar last night, as the dollar continued to slide with U.S. long-term treasury yields losing momentum. Despite the EUR/USD pair trading below its near-resistance level at around 1.0955, attention is now turning to the Eurozone's Consumer Price Index (CPI) scheduled for Thursday. A higher-than-expected CPI reading is anticipated to propel the Euro above its resistance level, adding a focal point for market participants in the coming days.
EUR/USD edged up slightly but the bullish momentum seems eased drastically. The MACD is declining toward the zero line while the RSI remains at an elevated level, suggesting the pair is still trading in bullish momentum.
Resistance level: 1.0950, 1.1065.
Support level: 1.0865, 1.0770.
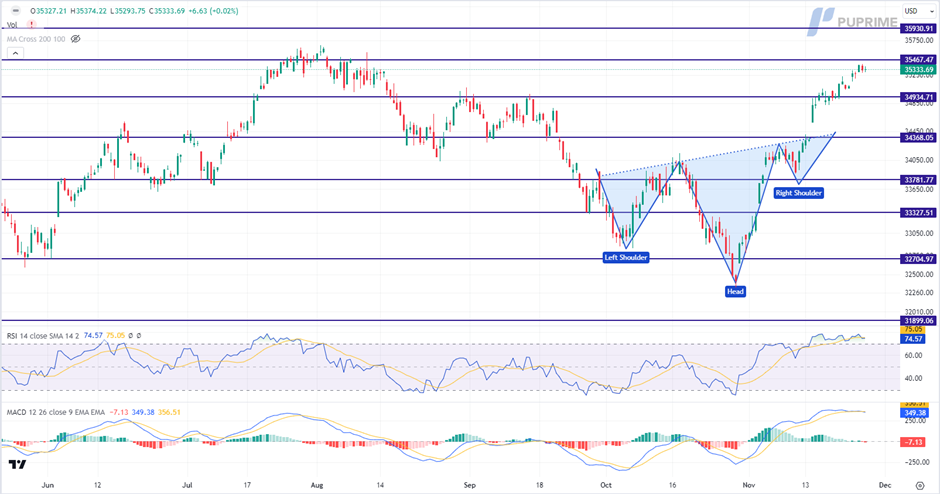
Dow Jones, H4
The US equity market remains relatively flat as investors exercise caution, awaiting key catalysts, notably significant economic data scheduled later in the week. Energy stocks bear the brunt of market dynamics, influenced by descending oil prices and escalating uncertainties preceding the OPEC+ meeting. Market participants keenly await the release of the Fed's preferred inflation gauge, the personal consumption expenditures price index, on Thursday, providing insights into potential market movements.
The Dow is trading higher while currently testing the resistance level. However, MACD has illustrated increasing bearish momentum, while RSI is at 75, suggesting the index might enter overbought territory.
Resistance level: 35465.00, 35930.00.
Support level: 34935.00, 34370.00.
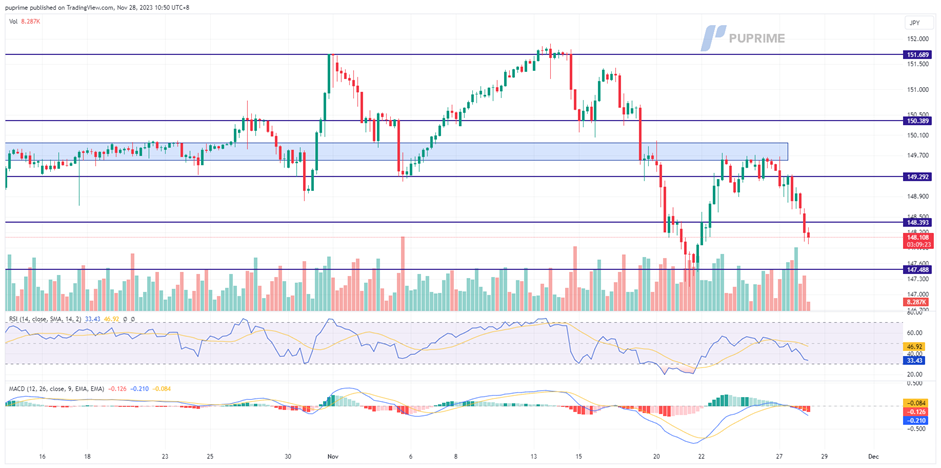
USD/JPY, H4
The USD/JPY pair is currently below a notable liquidity zone near the 149.80 level, indicating a potential trend reversal. The U.S. dollar remains weak as the market perceives the Federal Reserve has completed its interest rate hikes. In contrast, the recent hawkish tone from the Bank of Japan (BoJ) has strengthened the Japanese Yen. The latest Japan Consumer Price Index (CPI) data suggests sustainable inflation, increasing the likelihood that the BoJ may consider normalising its monetary policy in the near future. These factors contribute to the evolving dynamics in the USD/JPY pair.
The USD/JPY pair retraced sharply from the liquidity zone, suggesting a strong trend reversal for the pair. The RSI declines toward the oversold zone while the MACD declines from breaking above the zero line, suggesting the bearish momentum is forming.
Resistance level: 150.40, 151.70.
Support level: 147.48, 146.50.
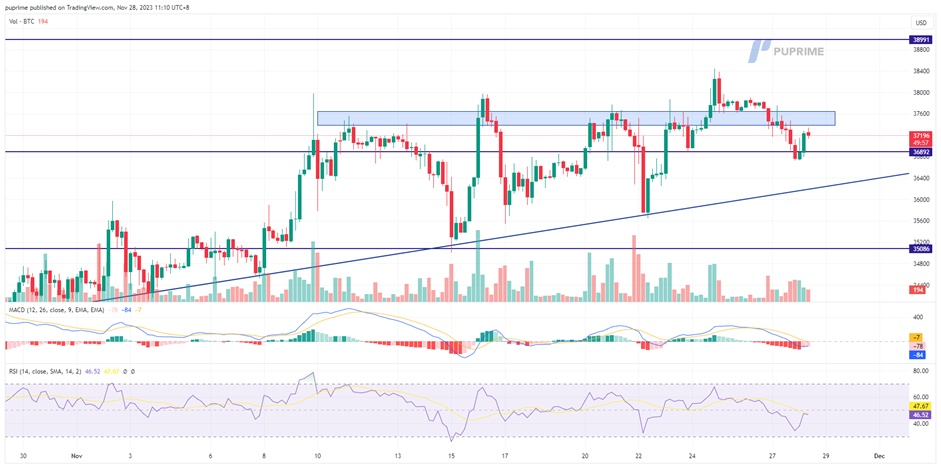
BTC/USD, H4
Bitcoin prices experienced a decline from a crucial liquidity zone yesterday but staged a technical rebound near its support level at $36,890. The bullish momentum, supported by Binance's agreement to plead guilty to charges from the U.S. Justice Department and positive sentiment surrounding the potential approval of a Bitcoin exchange-traded fund (ETF) by the SEC, appears to be fading, resulting in a relatively muted trading session yesterday.
BTC prices further eased from its liquidity zone, suggesting a short-term trend reversal for BTC. The MACD has broken below the zero line while the RSI declines toward the oversold zone, suggesting the bearish momentum is forming.
Resistance level: 38990, 41300.
Support level: 35080, 33430.
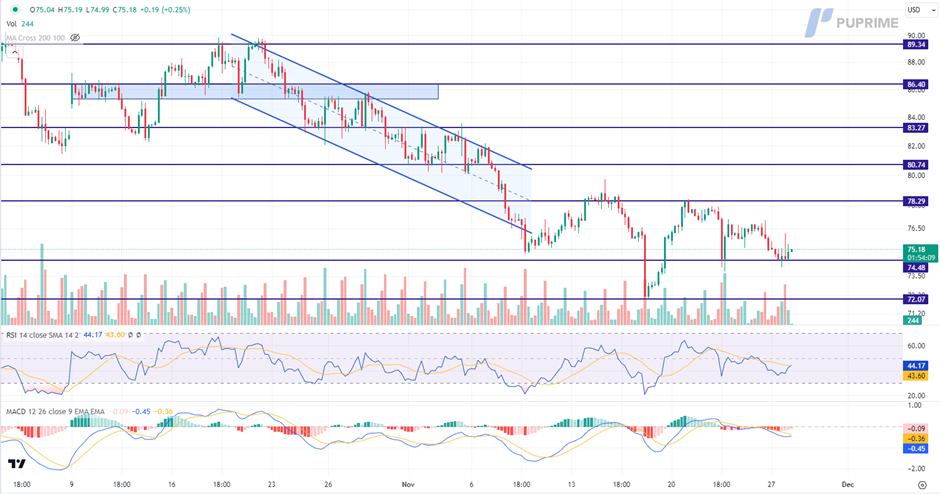
CL Oil, H4
Concerns persist regarding potential decisions on oil output cuts as investors focus intently on the upcoming OPEC+ meeting on November 30. Despite reports of Saudi progress in building consensus, apprehensions limit risk appetite for crude purchases ahead of the formal announcement. The International Energy Agency's projection of a slight surplus in global oil markets in 2024 underscores prevailing pessimism in the global economic outlook.
Oil prices are trading lower while currently testing the support level. However, MACD has illustrated diminishing bearish momentum, while RSI is at 44, suggesting the commodity might experience technical correction since the RSI rebounded sharply from oversold territory.
Resistance level: 78.30, 80.75.
Support level: 74.50, 72.05.
Author

PU Prime team
PU Prime
PU Prime is an award-winning CFD broker offering clients access to multiple products across multiple asset classes. Traders will have access to FX, Commodities, Indices, Share CFDs and Bonds.


