Dollar index vs. gold

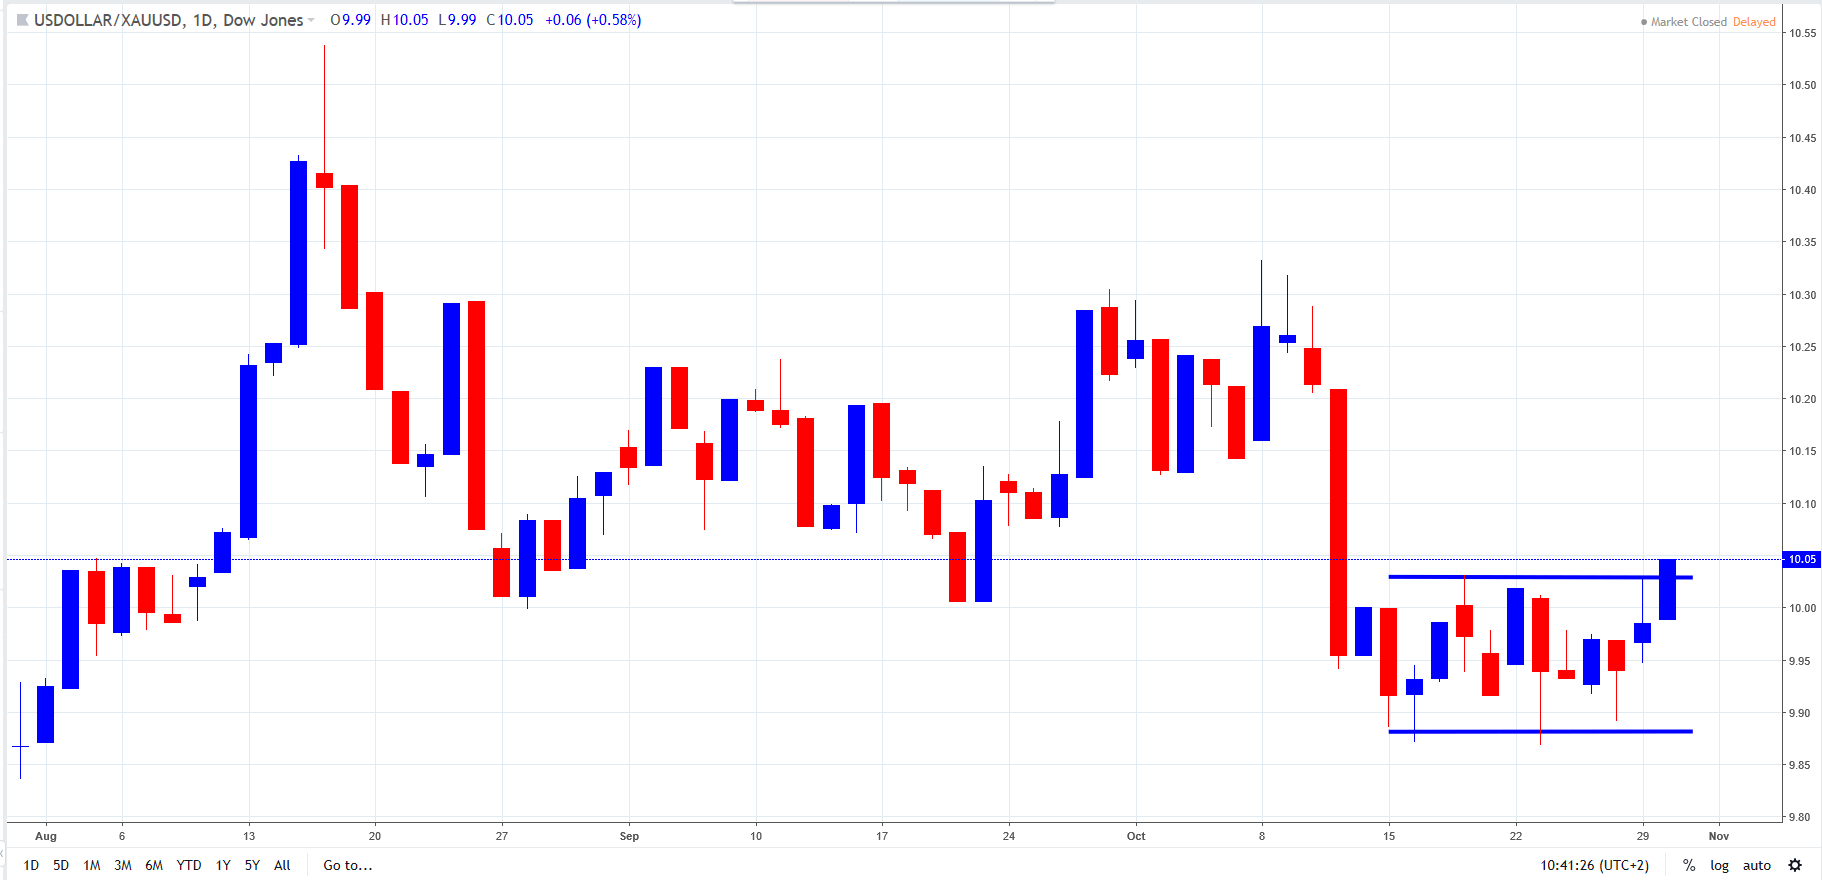
The left chart shows daily price action. The above chart shows daily price action of USDOLLAR:XAUUUSD. These two asset classes generally have an inverse relationship to one another. However, the ratio is currently consolidating in a small blue rectangle, which is indicative of an equilibrium. The ratio is challenging the upper blue trendline, indicating a current outperformance by the USDOLLAR.
Author

Russell Shor (MSTA, CFTe, MFTA) has an Honours Degree in Economics from the University of South Africa and holds the coveted Certified Financial Technician and Master of Financial Technical Analysis qualifications from the Interna
More from Russell Shor, CFTe, MFTA


