Dollar gains on upbeat retail sales

The Dollar index plummeted over 1.5% in the wake of the U.S. CPI release indicating a softening of inflationary pressures. Market reassesses the likelihood of further interest rate hikes in the U.S.
The U.S. dollar staged a modest recovery following a notable decline on Wednesday, spurred by indications of easing inflation from the U.S. CPI report. However, a resilient economic performance was underscored by the latest U.S. Retail Sales data released yesterday, surpassing expectations, and providing support for the greenback's upward nudge. Conversely, oil prices experienced a decline, influenced by the significant surge in U.S. crude oil stockpiles, exacerbating concerns about the demand outlook. Amidst this market backdrop, the Australian dollar maintained its elevated position, buoyed by robust job data signalling a persistently robust job market. Meanwhile, eyes are on the U.S.-China leaders' meeting, with implications expected across equities, the dollar, and commodities. The outcome may usher in market shifts and heightened volatility.
Market movements
Dollar Index
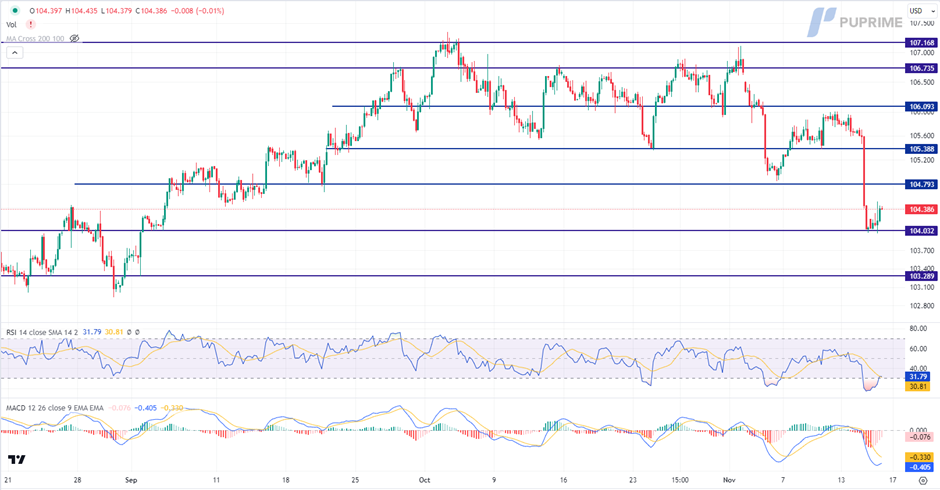
The US Dollar staged a recovery fueled by better-than-expected retail sales data, even as October's figures plummeted from 0.90% to -0.10%, significantly worse than the anticipated -0.30%, according to the Census Bureau. However, gains are constrained by the Federal Reserve's anticipated rate pause following a series of disappointing inflation reports. Ongoing US-China trade uncertainties further cloud the economic outlook, urging investors to closely monitor developments for nuanced trading signals.
The Dollar Index is trading higher following the prior rebound from the support level. MACD has illustrated diminishing bearish momentum, while RSI is at 32, suggesting the index might enter oversold territory.
Resistance level: 104.80, 105.40.
Support level: 104.05, 103.30.
XAU/USD
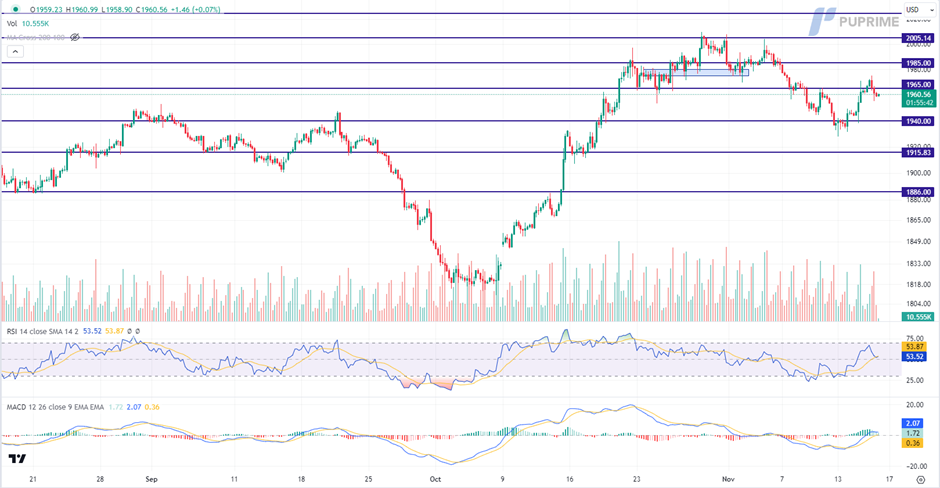
Gold prices witness a retreat amidst the appreciation of the US Dollar, rendering the dollar-denominated gold more expensive. Simultaneously, the ongoing US-China meeting takes centre stage for global investors. Positive developments in the meeting could potentially spark risk appetite in the global financial market, diminishing the appeal of safe-haven gold.
Gold prices are trading lower following the prior retracement from the resistance level. MACD has illustrated diminishing bullish momentum, while RSI is at 53, suggesting the commodity might extend its losses toward support level since the RSI retreated sharply from overbought territory.
Resistance level: 1965.00, 1985.00.
Support level: 1940.00, 1915.00.
GBP/USD
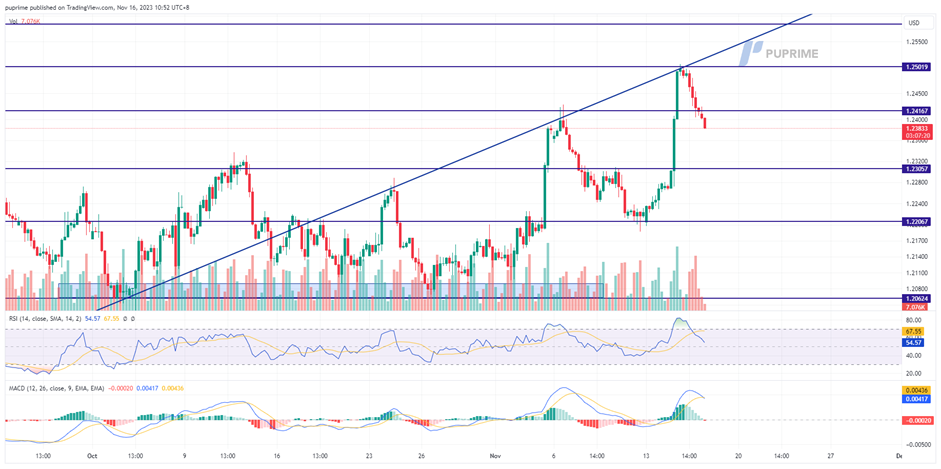
The British Pound stepped back from recent highs as the U.S. dollar staged a recovery. Lower-than-expected U.S. CPI data hinted at a potential peak in interest rates, briefly weakening the dollar. However, robust U.S. Retail Sales, surpassing market expectations, underscored economic resilience, revitalising the dollar's strength. Attention now turns to Friday's UK Retail Sales data release, shaping the Cable's trajectory.
Despite a technical retracement, the Cable has formed a higher high price pattern, suggesting a bullish trend for the pair. The RSI has dropped out of the overbought zone while the MACD is crossing above the zero line, suggesting the bullish momentum has eased.
Resistance level: 1.2420, 1.2501.
Support level: 1.2306, 1.2207.
AUD/USD
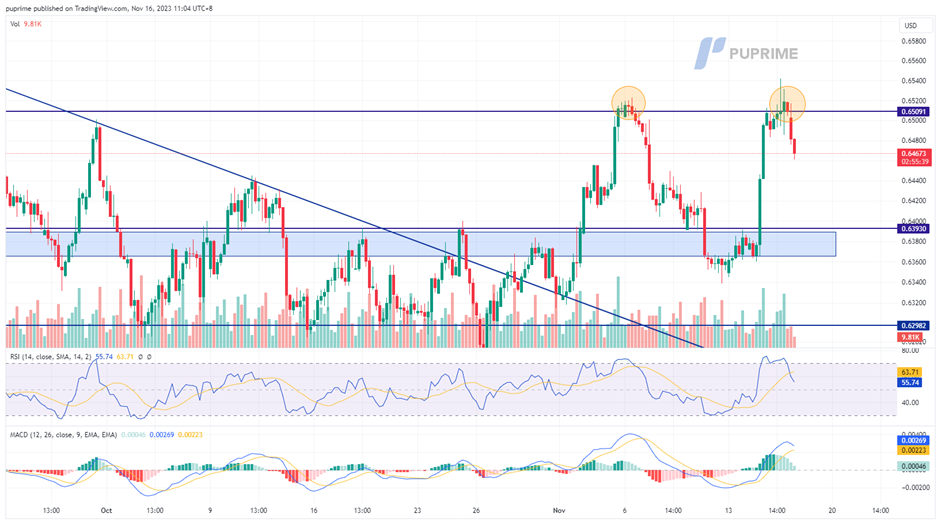
The Australian Dollar faces resistance at the robust level of 0.6510, forming a double-top pattern. Upbeat U.S. economic data, particularly strong retail sales figures, have buoyed the dollar's strength. Conversely, Australia's tight job market, as revealed in the latest employment data, suggests persistent inflation pressures, supporting the strength of the Aussie dollar.
The AUD/USD pair has retraced from its strong resistance level at 0.651 and is heading to the liquidity zone. The RSI has dropped out of the overbought zone while the MACD is on the brink of crossing, suggesting the bullish momentum is easing.
Resistance level: 0.6510, 0.6620.
Support level: 0.6390, 0.6300.
Nasdaq
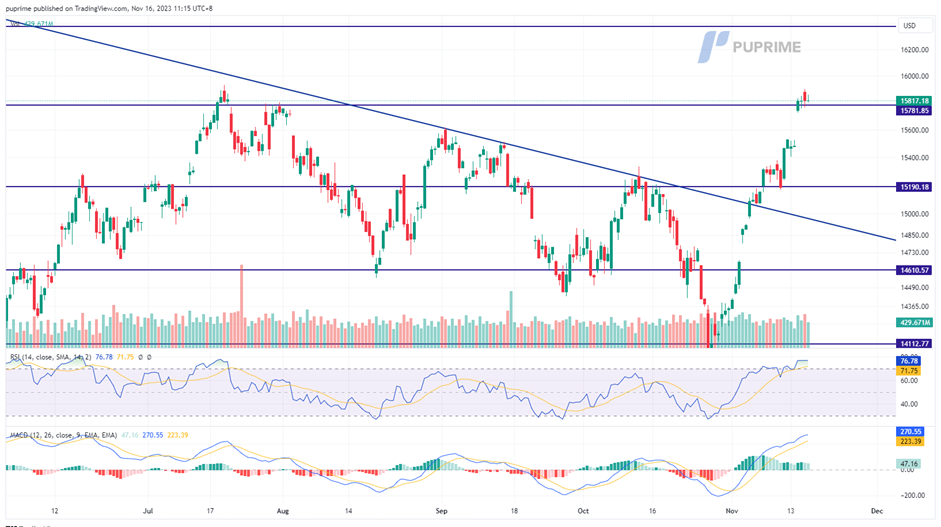
Wall Street was boosted as October's Producer Price Index (PPI) revealed a notable 0.5% decline, the most significant monthly drop since April. This, coupled with positive developments in Washington aimed at averting a government shutdown, propelled the index to its recent peak and set it on a course toward its all-time high at 16,764.
The Nasdaq is now hovering near the 16000 level, which was its recent peak; a break above this level will be a solid bullish signal for the index to challenge its all-time high at 16764. The RSI remain in the overbought zone while the MACD continues to move upward, suggesting the bullish momentum is strong.
Resistance level:16374.00, 17000.00.
Support level: 15200.00, 14610.00.

USD/JPY
The USD/JPY pair experienced a rebound near its support level of around 150.40, driven by a strengthening dollar following robust U.S. retail sales data indicating the resilience of the U.S. economy. Conversely, the Japanese Yen faced weakness against other currencies as Japan's GDP, revealed yesterday, fell short of expectations, potentially complicating the Bank of Japan's monetary policy decisions.
USD/JPY was suppressed at its strong resistance level but has quickly rebounded and erased most of its losses from yesterday. The RSI has rebounded while the MACD has crossed, suggesting the bullish momentum is forming.
Resistance level: 151.70, 152.70.
Support level: 150.40, 149.30.
BTC/USD
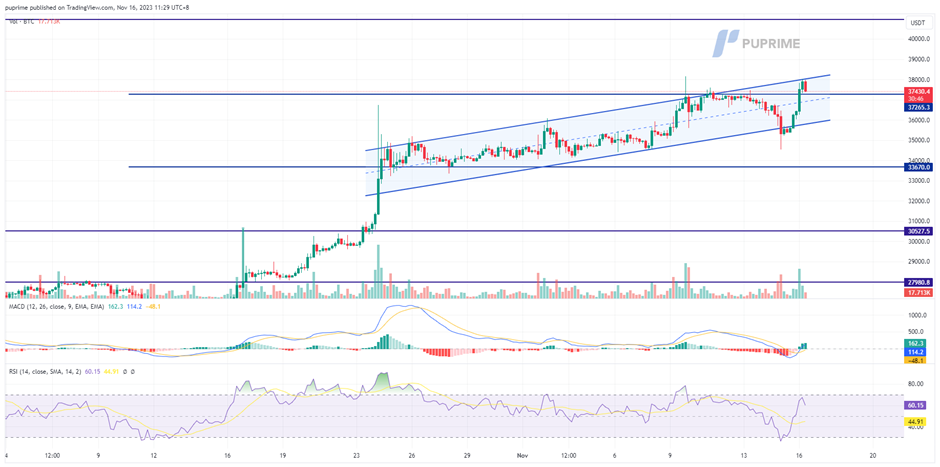
Bitcoin experienced a robust rebound, surging over 6.5% yesterday amid heightened optimism surrounding the potential approval of a Bitcoin ETF by the SEC. However, the SEC has deferred its decision on whether to approve the first U.S. Bitcoin ETF, with speculation suggesting a possible approval in January next year. Launching a Bitcoin ETF is anticipated to provide institutions and investors with a regulated avenue for exposure to Bitcoin.
BTC remains trading within its uptrend channel, suggesting a bullish trend. The RSI spiked up sharply and is on the brink of breaking into the overbought zone, while the MACD has crossed and broken above the zero line, suggesting the bullish momentum is still intact with BTC.
Resistance level: 40960, 44670.
Support level: 33700, 30600.
CL Oil
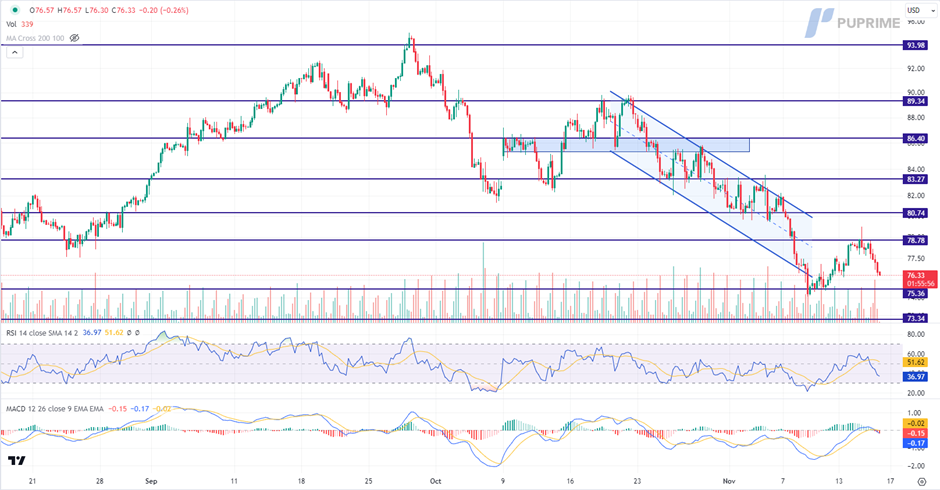
Oil prices undergo a substantial decline following the long-anticipated inventory report. The US Energy Information Administration (EIA) reveals a significant surge of 3.60 million barrels last week, reaching 421.9 million barrels, far surpassing the market's expectation of a 1.80-million-barrel rise. The unexpected inventory increase adds pressure to oil prices, marking a notable downturn in the market.
Oil prices are trading lower following the prior retracement from the resistance level. MACD has illustrated increasing bearish momentum, while RSI is at 37, suggesting the commodity might extend its losses since the RSI stays below the midline.
Resistance level: 78.80, 80.75.
Support level: 75.35, 73.35.
Author

PU Prime team
PU Prime
PU Prime is an award-winning CFD broker offering clients access to multiple products across multiple asset classes. Traders will have access to FX, Commodities, Indices, Share CFDs and Bonds.


