Dollar gains and equities slip, with Powell’s testimony eyed

Market Overview
The surprisingly strong payrolls report has shifted expectation of what the Fed might do at its meeting at the end of July. The prospect of a 50 basis point rate cut is being priced out, and it seems that the market is convinced now that a 25 basis point insurance cut is to be expected. How Jerome Powell sets out his stall at the Congressional testimonies (on Wednesday and Thursday) this week could be crucial as to whether the market needs to account for maybe even no cut. There is also key CPI inflation data that the market will be watching. Subsequently, a repeat of yesterday’s rather quiet session could be seen again today. As a result of the payrolls report Treasury yields have jumped with yield differentials in the favour of a stronger dollar. On the 10s, Treasury yields are 10 are around 10 basis points higher, whilst yields on Gilts and Bunds are around 5 basis points higher. Subsequently, the dollar has recovered across the forex majors. A degree of consolidation is latterly setting in and Powell’s testimonies are likely to be the next mover. For now, equities are slipping, on the reduced expectation of how dovish the Fed will be.

On Wall Street there was another slip into the close, with the S&P 500 -0.5% at 2976. US futures are again a shade lower, by around -0.3%. This has left Asian markets mixed to slightly weaker, with the Nikkei +0.1% whilst the Shanghai Composite was -0.4%. In Europe there is a sense of following the US futures lower, with FTSE futures -0.2% and DAX futures -0.6%. In forex, there is a continuation of the mild USD gains of yesterday, although aside from the underperformance on AUD and GBP, there is little decisive direction. In commodities, the dollar gains are hitting gold again which is around -$2, whilst oil has also rolled over again.
It is a light day again on the economic calendar, with US JOLTS jobs openings at 1500BST the only real data of note. The JOLTS are expected to show a very slight increase in May to 7.47m (from 7.45m in April). However, there are a few central banker speakers today, all from FOMC voters. The key one will obviously be Fed chair Powell who speaks at an event of the Boston Federal Reserve. However, given that he testifies before Congress on Wednesday, perhaps he will keep his powder dry today. Also look for the FOMC’s James Bullard (voter, dove) at 1510BST who was the lone dissenting voice calling for a rate cut at the June FOMC meeting. Bullard recently rowed back on potential for a -50bps cut. Also look for the FOMC’s Randall Quarles (permanent voter, centrist) who speaks at 1900BST who has leaned hawkish previously and could be considered a key voter when it comes to changing rates in July.
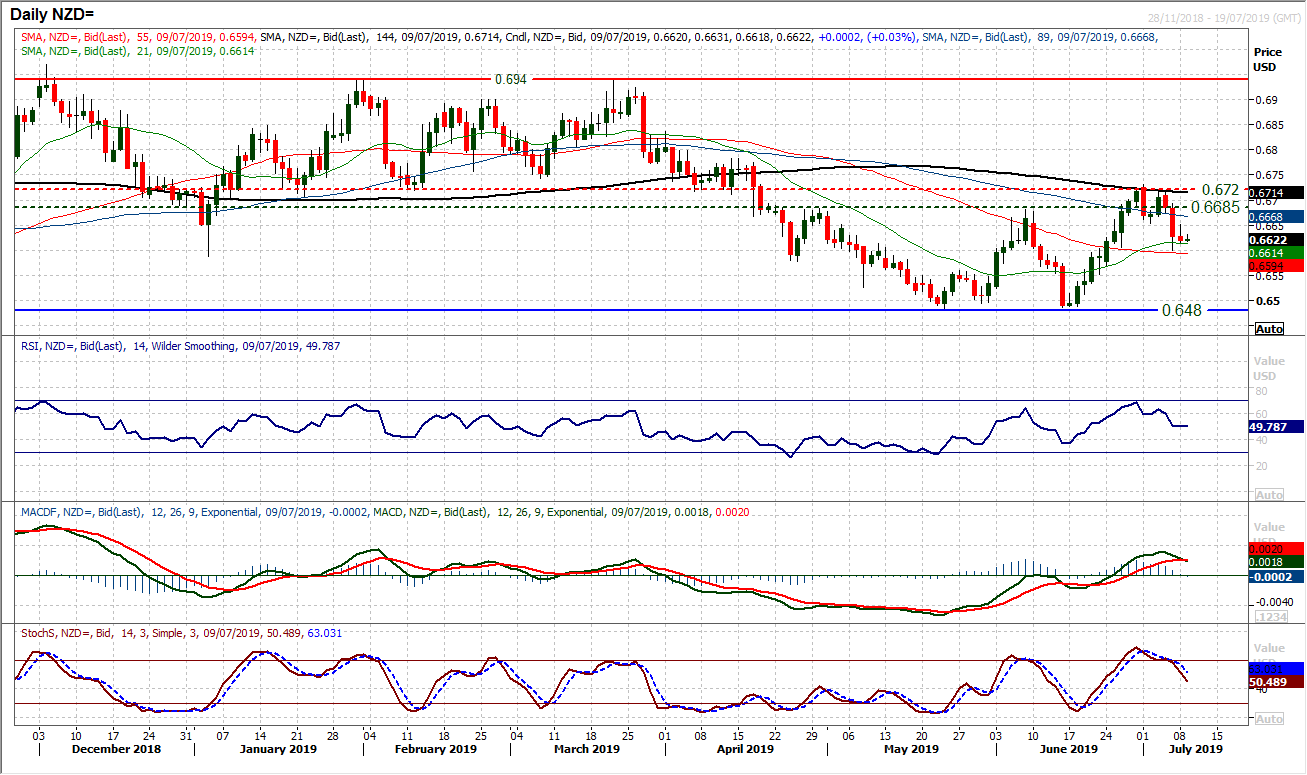
Chart of the Day – NZD/USD
We looked at the late June rally on the Kiwi a couple of weeks ago which was hitting the long term pivot band $0.6685/$0.6720. Subsequent corrective/sell signals are now racking up and the outlook is turning corrective again. Since the bearish engulfing candlestick left a high at $0.6730, lower highs and lower lows are now forming. A bear cross on the Stochastics has confirmed, whilst a bear cross is also threatening on MACD lines. This would be the first MACD bear cross since March when the market then embarked upon a sustained two month sell-off. Yesterday’s intraday rebound failed at the resistance around $0.6655 and another lower high back under the pivot $0.6685 would add to the growing sense of selling into strength now. With a bear candle (including a close near the day low) yesterday, the sellers are increasingly in control. A retest of Friday’s low at $0.6600 can be expected, whilst the key long term range support comes in at $0.6480.
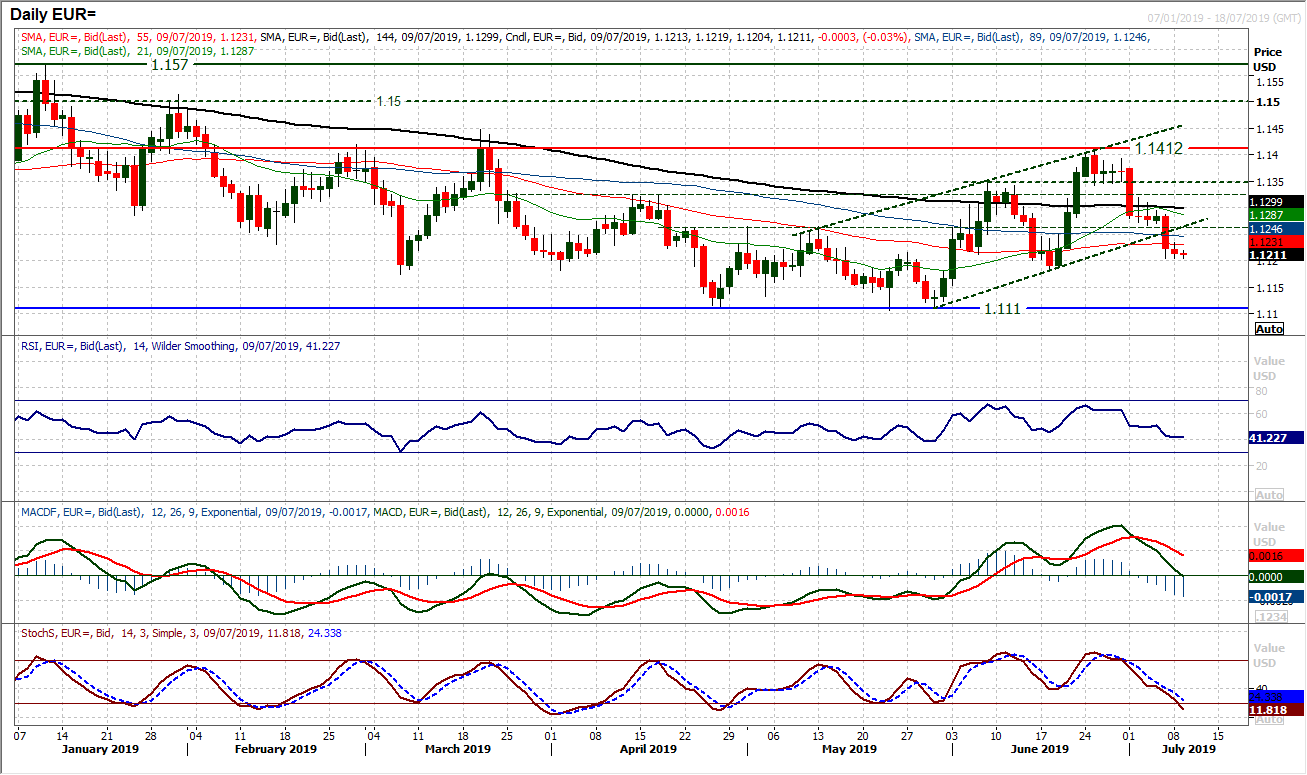
EUR/USD
The sharp negative candlestick that has damaged the medium term improvement, continues to be the overriding technical factor now. Yesterday’s mild negative candle simply reinforces the corrective aspect now on the chart. Trading below all the moving averages (which are now turning lower) along with sharp deteriorations in Stochastics and MACD lines, shows how the sellers are in control of the two week decline. A test of $1.1180 is now preferred and that would be the key test for the medium term outlook. Breach would be a key higher low broken and turn the outlook decisively negative. Overhead resistance is building. The old pivot at $1.1265 initially (also around the underside of the old uptrend channel), before a clutch of resistance between $1.1300/$1.1350. Rallies are a chance to sell now.
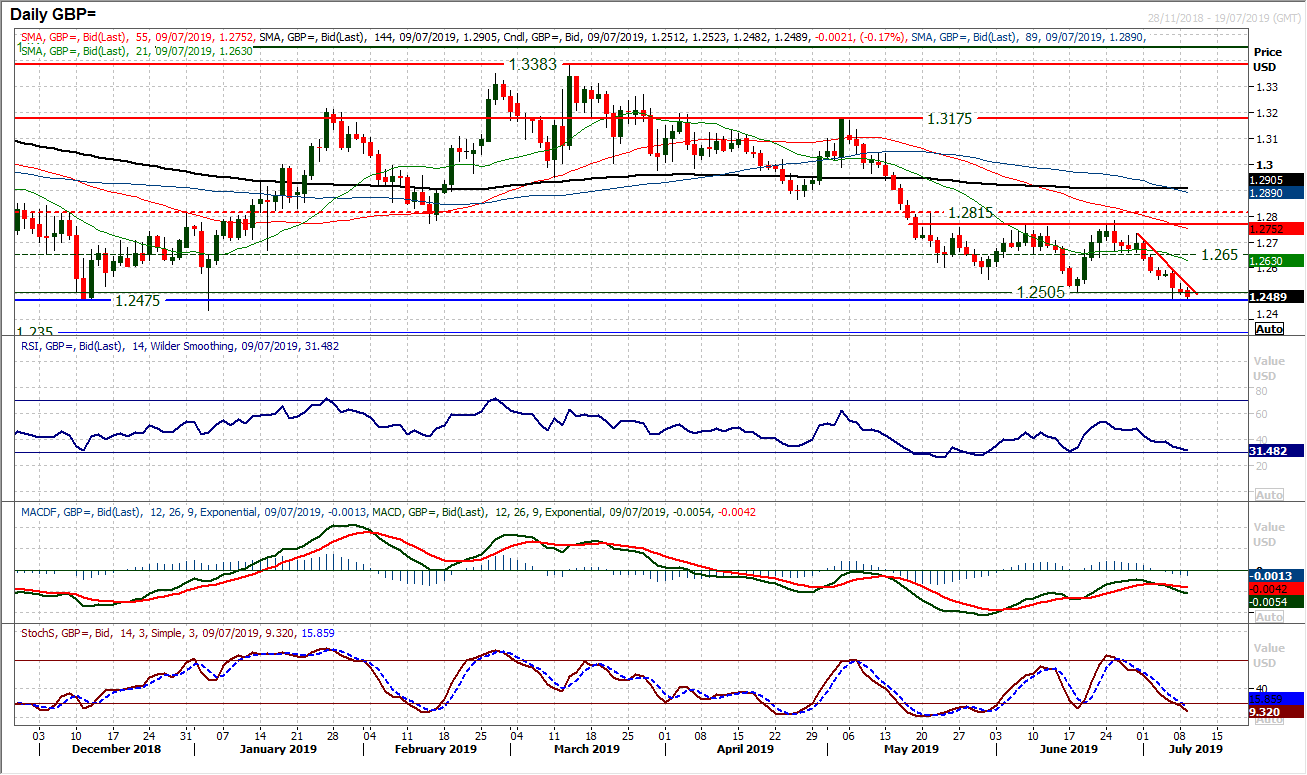
GBP/USD
The run of negative closes and candles in the past couple of weeks has now formed a downtrend which is tracking Cable for growing pressure on the support band $1.2475/$1.2505. The worry is that momentum indicators are negatively configured with further downside potential for the test. This support band is the bottom of what is essentially now a seven week trading range and a closing breach of $1.2475 would imply 300 pips of downside projection target. The hourly chart shows a classic selling momentum, with the hourly RSI failing between 50/55, and the hourly MACD lines failing around neutral. It also shows that old support consistently becomes new resistance, with $1.2650 and subsequently $1.2560 being barriers to recovery. Although the market held up reasonably well yesterday, expect pressure on $1.2475 to continue. Above $1.2590 is needed to initially suggest the bulls fighting back.
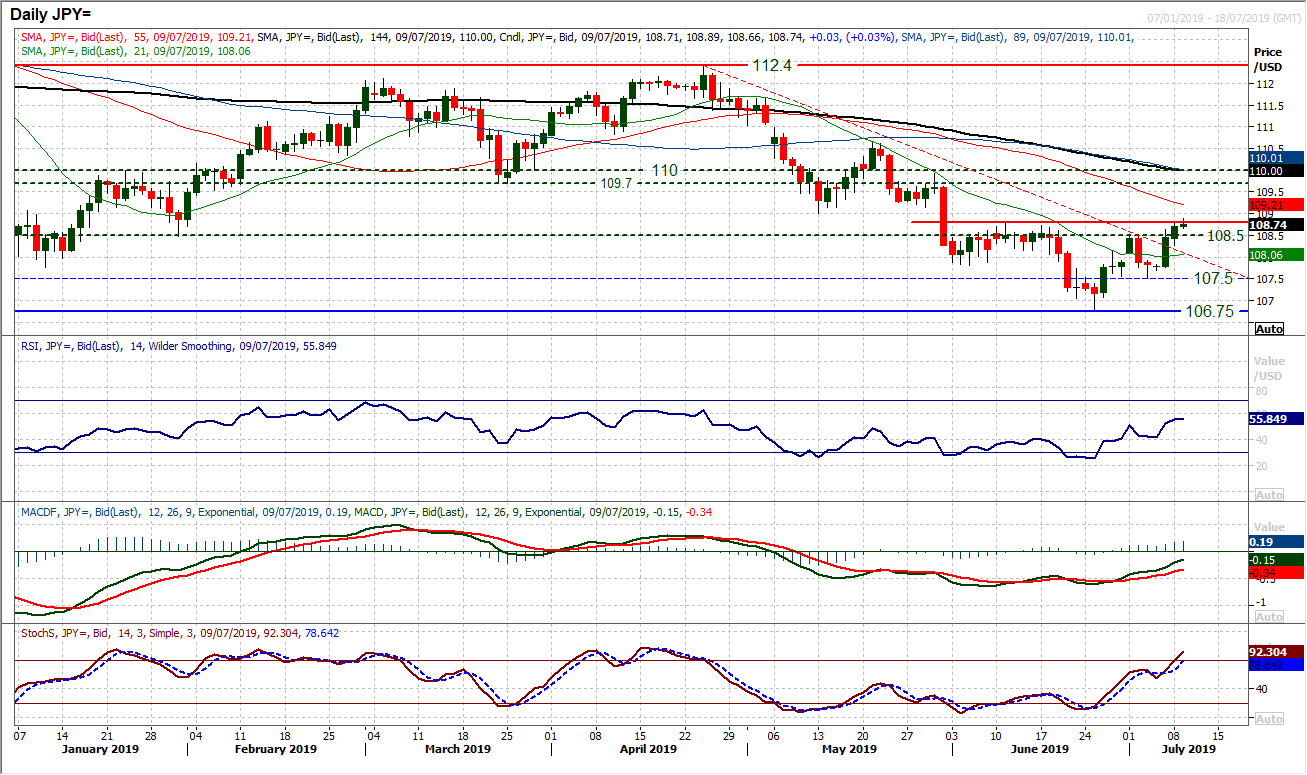
USD/JPY
The dollar recovery prospects are growing. A decisive closing break above 108.50 could not be achieved in June, but yesterday’s candlestick showed that something is building now. This comes with the momentum indicators leading the market higher. The RSI and Stochastics are climbing at two and a half month highs, with Stochastics also improving strongly. Downtrends are being broken and the market is close to a 200 pip base pattern. A closing breach of 108.80 would complete the base and imply a move towards the mid-May high at 110.65 is back on. It is important to say that this continues to be a recovery within what is still a medium term negative outlook (MACD lines showing that), however the dollar bulls are finally fighting back. The hourly chart shows a minor negative divergence that needs to be watched, but for now there is a band of support 108.15/108.25 which is growing in importance, whilst the breakout around 108.50/108.60 is initially supportive.
Gold
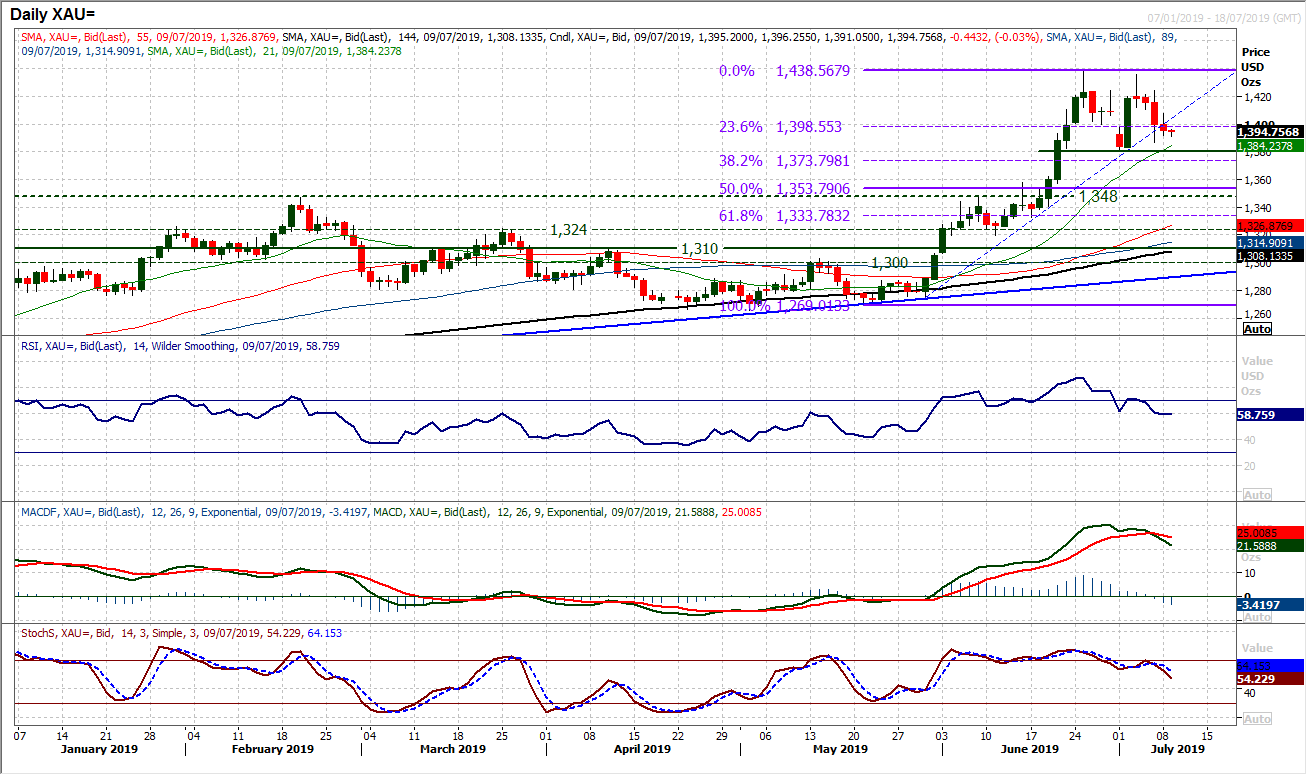
The profit taking signals are mounting on gold as yet another negative daily candlestick was formed yesterday. This now means that in the course of the past nine sessions there has been just one positive candle. As the market continues to drift off the bulls will be concerned that yesterday’s intraday rally was once more seen as a chance to sell. A broken five week uptrend and a move back under $1400 (along with a breach of the 23.6% Fibonacci retracement). The concern grows with the negative signals coming across all the momentum indicators. RSI is below 60, Stochastics getting traction in a move lower and the MACD lines have bear crossed. This points to selling into intraday strength for pressure on the key July low at $1381.50. Last Friday’s low at $1386.50 is initial support, but the hourly chart is developing an increasingly corrective configuration. A higher low at $1407.60 under $1410, whilst $1424 is a near term lower high. A closing breach of $1381.50 would open a correction back towards $1348/$1354 area.
WTI Oil
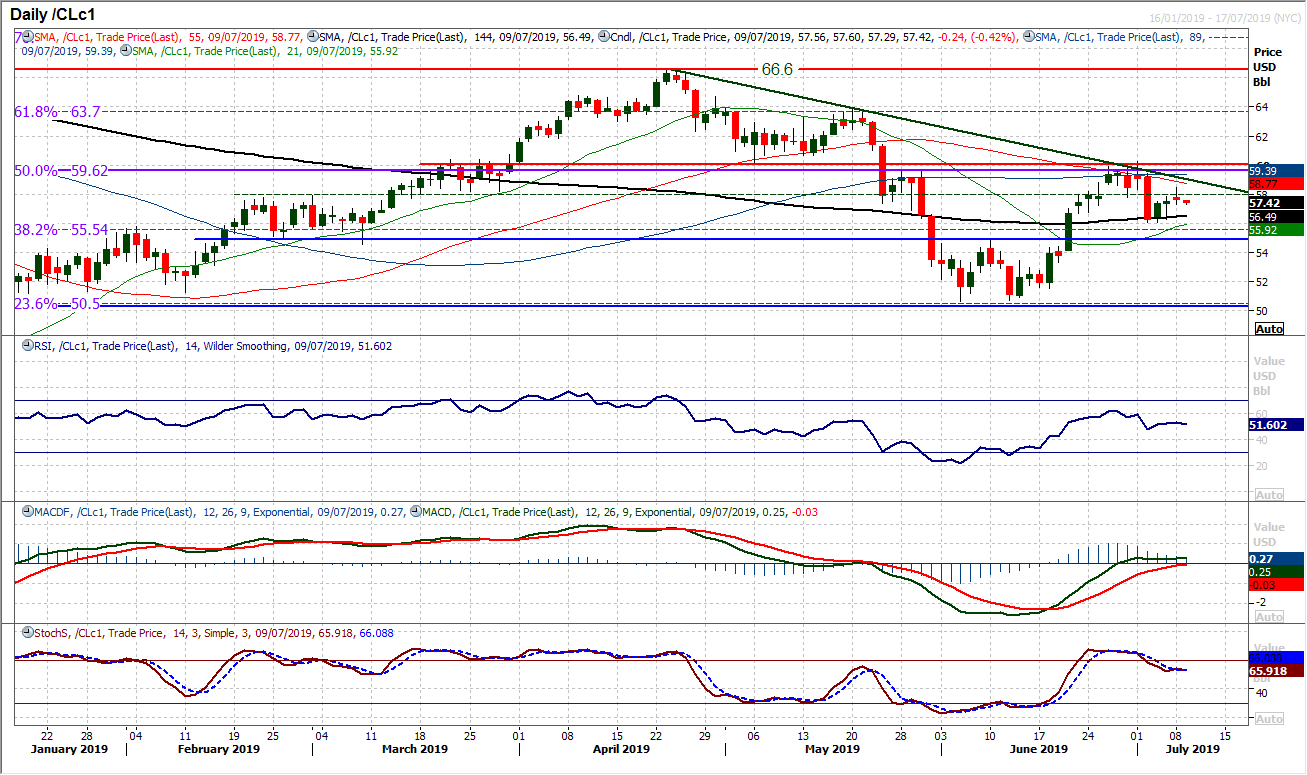
A third positive close in a row suggests that the corrective pressure has at least eased for now. However, the tepid nature of the candlesticks in the past couple of sessions implies that there is still considerable resistance to overcome for a recovery to be sustainable. The near term outlook remains uncertain (especially given the two very small candlestick bodies), but also given the barriers overhead. A near three month downtrend looms overhead at $59.00 today, whilst it is interesting to see the falling 55 day moving average has become a good gauge for the market and is currently acting as resistance (today around $58.75). The pivot band around $58.00 is a barrier too. Momentum indicators have a rolling over element too, with MACD lines plateauing around neutral. Initial resistance at yesterday’s high of $58.45 and as the market rolls over again a move to test support at $56.05 is preferred before further downside to the 38.2% Fib at $55.55.
Dow Jones Industrial Average
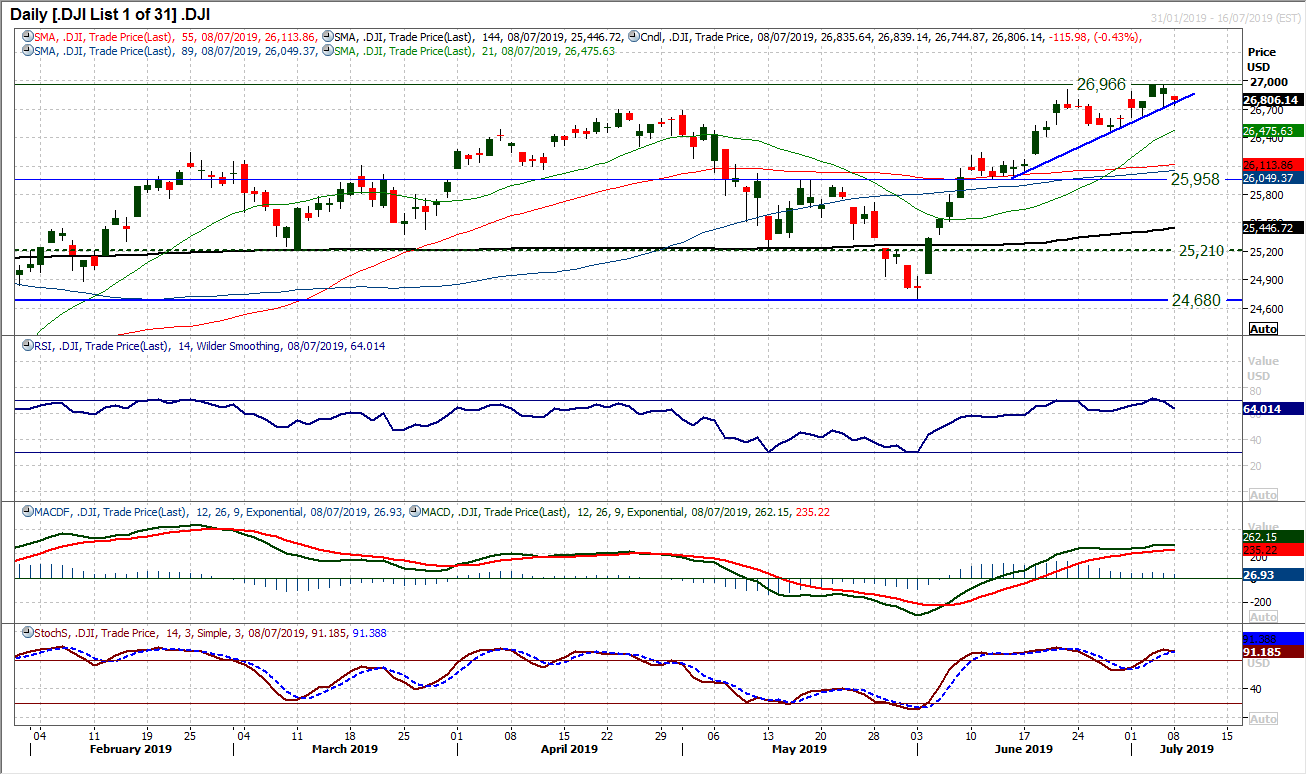
Despite the lack of action during yesterday’s quiet session, there is a slow creep lower that is beginning to threaten. Unless the bulls get a handle on the situation fairly quickly, it could develop into a more considerable correction. A three week uptrend is being tested and if the futures continue to suggest a weaker open, a trend breach is on the cards. Momentum indicators are beginning to sag a little too, and if the daily RSI slips under 60 this would be a signal to note. Initial support is at 26,633 but the main support is still the late June higher reaction low at 26,435. If this were to be breached it would signal a trend change. For now this remains a near term unwind, but if supports begin to be breached it could turn into something bigger. The new all-time high at 26,966 is the main resistance of note.
Author

Richard Perry
Independent Analyst


