DJIA Fractal Forecast Showing a Wild Roller Coaster Year
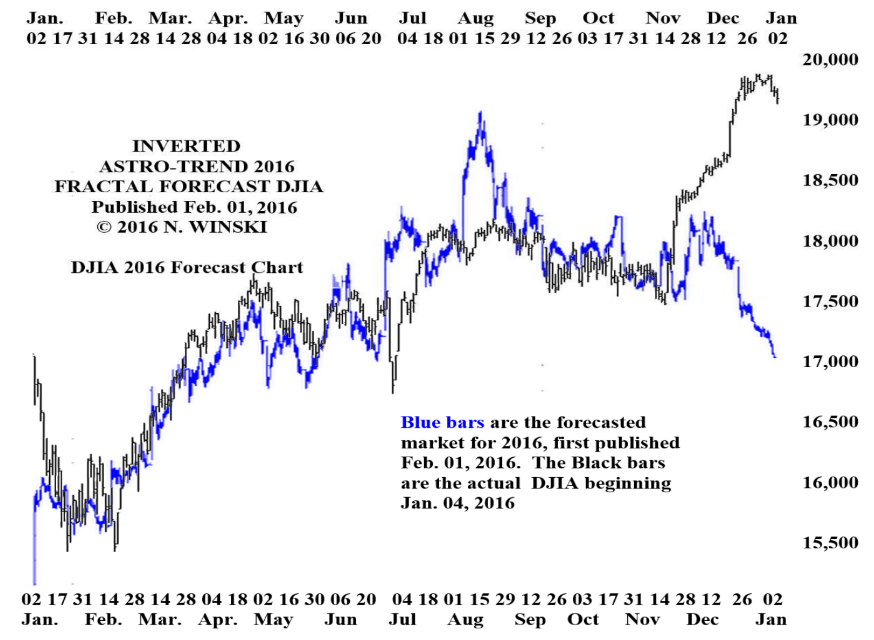
An old Wall Street adage says, “As January goes, so goes the year”. This was the inspiration for our Dow Jones Industrial Average Fractal Forecast, for which you can now see the following 2016 forecast results. Our fractal model takes the January Barometer to a higher level of detail in that it shows forecasted highs and lows for the coming year.
The traditional January Barometer has been shown to be accurate, based on data since 1950, about 75% of the time, in forecasting the trend for the year. January 2016 showed a clear down trend, with the DJIA closing down 5.5% for the month. However, occasionally the model inverts and this is what happened for most of 2016.

The 2017 DJIA Fractal Forecast is showing a wild roller coaster year which, following big ups and big downs, will likely end the year nearly unchanged. One interesting point is that the regular model is showing the lowest low for about August 7, on which there will be a Lunar Eclipse. Given there are only two Lunar Eclipses in a year, this is rather amazing that the Fractal Model seems to be in near perfect synch with the major planetary events months in advance.
The 2017 Fractal Futures Forecast is ready now! This covers 27 futures related markets for the rest of 2017. These forecasts are time sensitive, so you will want to get yours as soon as possible. Subscribe this week and you can get a free 10 minute class with me on Skype to show you how to use these forecasts. These forecasts are very simple, very easy to use, and have been amazingly accurate for many years. E-mail subject line: Get 2017 Fractal Futures Forecast.
The traditional January Barometer has been shown to be accurate, based on data since 1950, about 75% of the time, in forecasting the trend for the year. January 2016 showed a clear down trend, with the DJIA closing down 5.5% for the month. However, occasionally the model inverts and this is what happened for most of 2016.
The 2017 DJIA Fractal Forecast is showing a wild roller coaster year which, following big ups and big downs, will likely end the year nearly unchanged. One interesting point is that the regular model is showing the lowest low for about August 7, on which there will be a Lunar Eclipse. Given there are only two Lunar Eclipses in a year, this is rather amazing that the Fractal Model seems to be in near perfect synch with the major planetary events months in advance.
The 2017 Fractal Futures Forecast is ready now! This covers 27 futures related markets for the rest of 2017. These forecasts are time sensitive, so you will want to get yours as soon as possible. Subscribe this week and you can get a free 10 minute class with me on Skype to show you how to use these forecasts. These forecasts are very simple, very easy to use, and have been amazingly accurate for many years. E-mail subject line: Get 2017 Fractal Futures Forecast.
This is an excerpt from the Astro Trend newsletter. Astro-Trend covers about thirty futures related markets including the major Financial Markets, such as the Stock Market, T-Bonds, Currencies, and most major commodities. We also offer intra day data which identifies potential change in trend points to the minute.
Author

Norm Winski
Independent Analyst
www.astro-trend.com
More from Norm Winski


