Did the S&P500 put in a major bottom?

We primarily track the S&P 500 (SPX) using the Elliott Wave Principle (EWP). The EWP allows us to identify the potential paths the market can take based on known patterns, which must adhere to specific price-based rules. Since we cannot predict the future, the EWP can help us identify the most likely path. However, since financial markets are non-linear, stochastic, and probabilistic, we must, like any other forecasting discipline, always “anticipate, monitor, and adjust if necessary.”
With that in mind, in our August 8 update, when the SPX was trading at ~$5300, see here, we were looking for a rally. Either as a five-wave impulse:
“… the index may now work on five (green) waves back up to ideally $5650+/-50 for the red W-i of the black W-5.”
Or, as a three-wave counter-trend rally:
“…the current rally from Monday’s [August 5] low is only a bounce back to around $5550+/-50 before the red W-c back down to ideally the 38.20% retracement of the W-3 at around $4950+/-25 kicks in.”
Fast-forward and the index is now trading at $5640. Thus, so far, so good. But the question now is, “Will it be five waves up or not?” See Figure 1 below.
Figure 1. Daily SPX chart with detailed EWP count and technical indicators
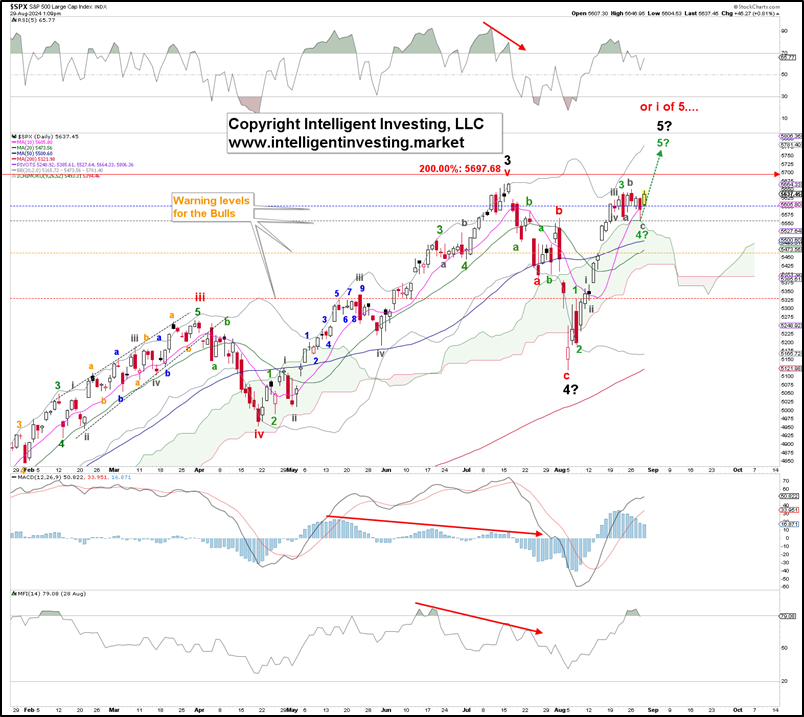
Yesterday’s low could have been the green W-4 of the new impulse up. All the market must do is break above last week’s high to confirm the green W-5. Moreover, as the index increased during the days after our last update, we raised the Bulls’ colored warning levels accordingly to help tell our premium members below which levels further upside would become less likely. The index has dropped below the blue first warning level but held the grey second warning level. A daily close below will be a good sign that the next leg lower has started, with a break below the orange level at $5470, essentially the second-to-last nail in the Bulls’ coffin.
However, before the Bears get too excited, they should note that the index’s price is above its rising 10-day simple moving average (d SMA), above the rising 20d SMA, 50d, and 200d SMA. Besides, the index is also above the rising Ichimoku Cloud. Thus, the current trend is almost 100% Bullish trend (only the 20d SMA is below the 50d SMA).
Moreover, the technical indicators are still pointing higher. The MACD is on a buy, and the Money Flow (MFI) just registered overbought conditions (>70), as it did in February and June of this year. Both instances lead to minor pullbacks followed by higher prices.
Thus, our forecast for higher prices three weeks ago was correct. At this stage, it seems like a small effort for the Bulls to muster a five-wave impulse up off the August 5 low, and a break above last week’s high will confirm this thesis and target, ideally, $5750+/-25. Although the daily chart setup is Bullish, the Bears can only gather strength by a break below, at least, today’s open, the blue warning level. Thus, thanks to the EWP, we have been on the right side of the trade over the past three weeks and now have a simple risk/reward trade setup again.
Author

Dr. Arnout Ter Schure
Intelligent Investing, LLC
After having worked for over ten years within the field of energy and the environment, Dr.


