Deepseek spooks markets

USD: Mar '25 is Up at 107.840.
Energies: Mar '25 Crude is Up at 73.70.
Financials: The Mar '25 30 Year T-Bond is Down 14 ticks and trading at 113.30.
Indices: The Mar '25 S&P 500 emini ES contract is 21 ticks Higher and trading at 6052.00
Gold: The Feb'25 Gold contract is trading Up at 2746.70.
Initial conclusion
This is not a correlated market. The USD is Up and Crude is Up which is not normal, but the 30 Year T-Bond is trading Lower. The Financials should always correlate with the US dollar such that if the dollar is Higher, then the bonds should follow and vice-versa. The S&P is Higher and Crude is trading Higher which is not correlated. Gold is trading Higher which is not correlated with the US dollar trading Up. I tend to believe that Gold has an inverse relationship with the US Dollar as when the US Dollar is down, Gold tends to rise in value and vice-versa. Think of it as a seesaw, when one is up the other should be down. I point this out to you to make you aware that when we don't have a correlated market, it means something is wrong. As traders you need to be aware of this and proceed with your eyes wide open. Asia traded Mainly Higher. All of Europe is trading Higher as well.
Possible challenges to traders
-
Core Durable Goods m/m is out at 8:30 AM EST. This is Major.
-
Durable Goods is out at 8:30 AM EST. This is Major.
-
S&P/CS Composite-20 HPI y/y is out at 9 AM EST. This is Major.
-
HPI m/m is out at 9 AM EST. This is Major.
-
CB Consumer Confidence is out at 10 AM EST. This is Major.
-
Richmond Manufacturing Index is out at 10 AM EST. This is Major.
Traders, please note that we've changed the Bond instrument from the 10 year (ZN) to the 2 year (ZT). They work exactly the same.
We've elected to switch gears a bit and show correlation between the 2-year Treasury notes (ZT) and the S&P futures contract. The YM contract is the Dow Jones Industrial Average, and the purpose is to show reverse correlation between the two instruments. Remember it's likened to a seesaw, when up goes up the other should go down and vice versa.
Yesterday the ZT migrated Lower at around 7 AM EST with no economic news in sight. The Dow moved Higher at the same time. Look at the charts below and you'll see a pattern for both assets. The Dow moved Higher at 7 AM EST and the ZT moved Lower at around the same time. These charts represent the newest version of Bar Charts, and I've changed the timeframe to a 15-minute chart to display better. This represented a Short opportunity on the 2-year note, as a trader you could have netted about 20 plus ticks per contract on this trade. Each tick is worth $7.625. Please note: the front month for ZT is now Mar '25 and the Dow is now Mar '25. I've changed the format to filled Candlesticks (not hollow) such that it may be more apparent and visible.
Charts courtesy of BarCharts
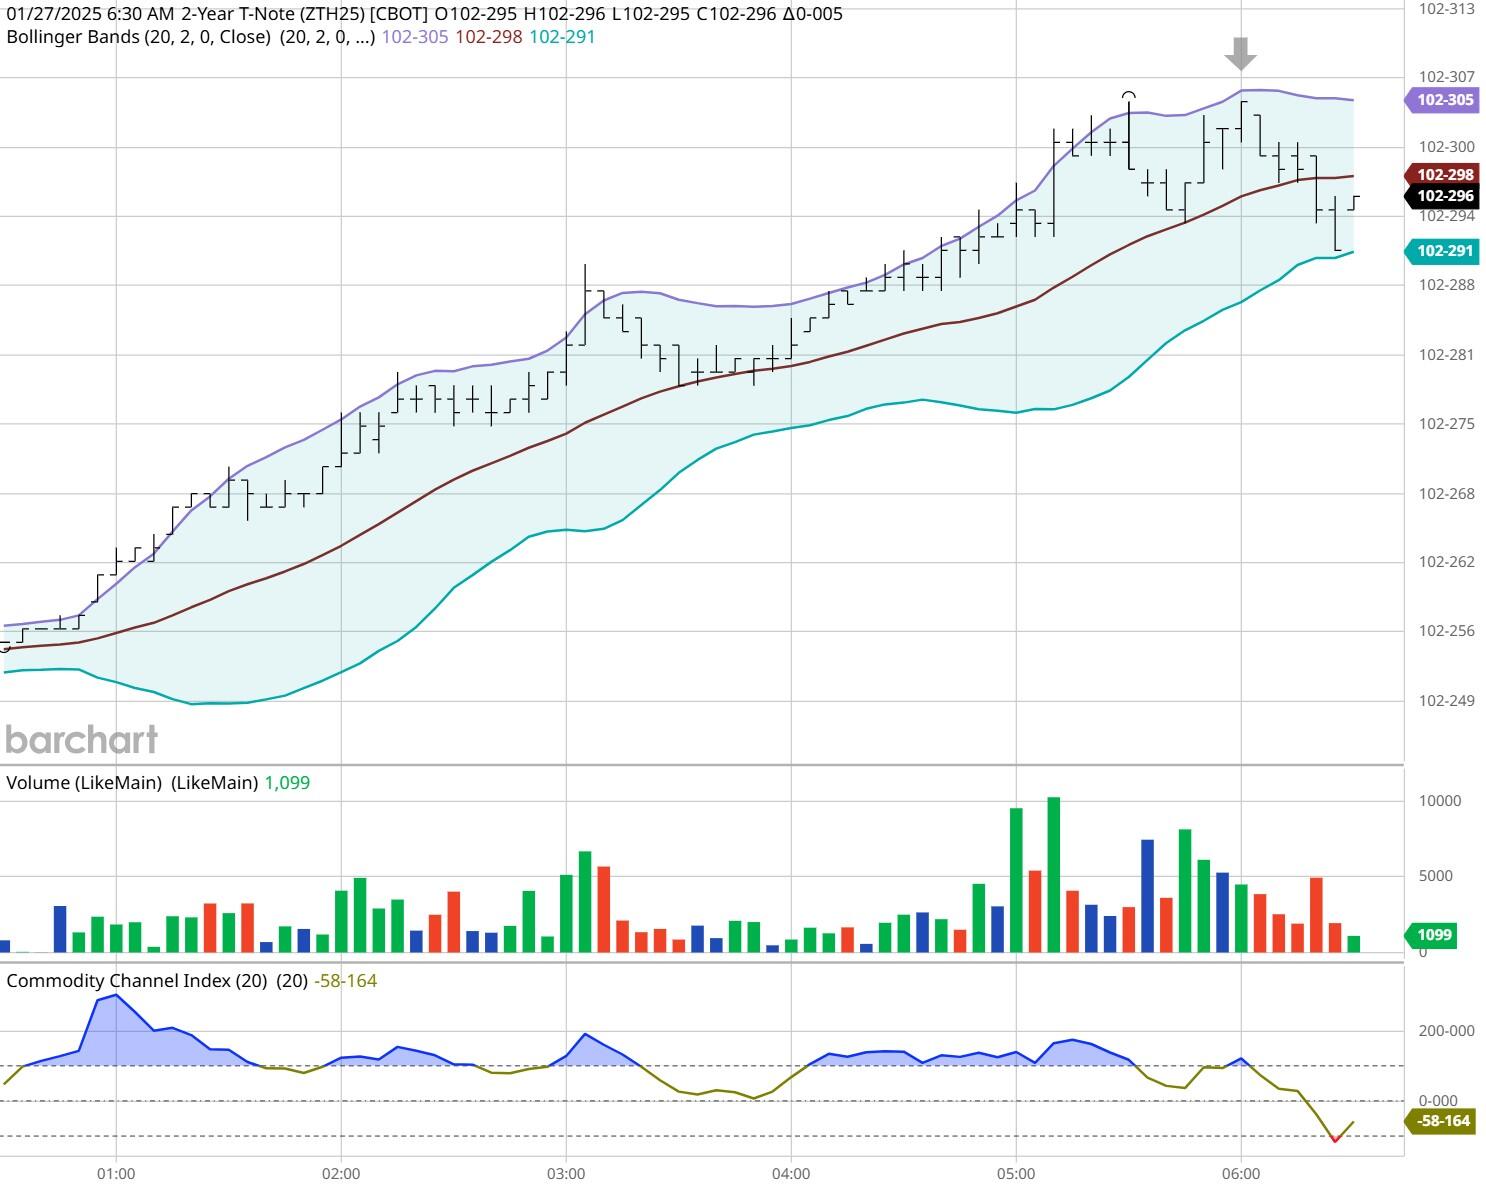
ZT -Mar 2025 - 1/27/25
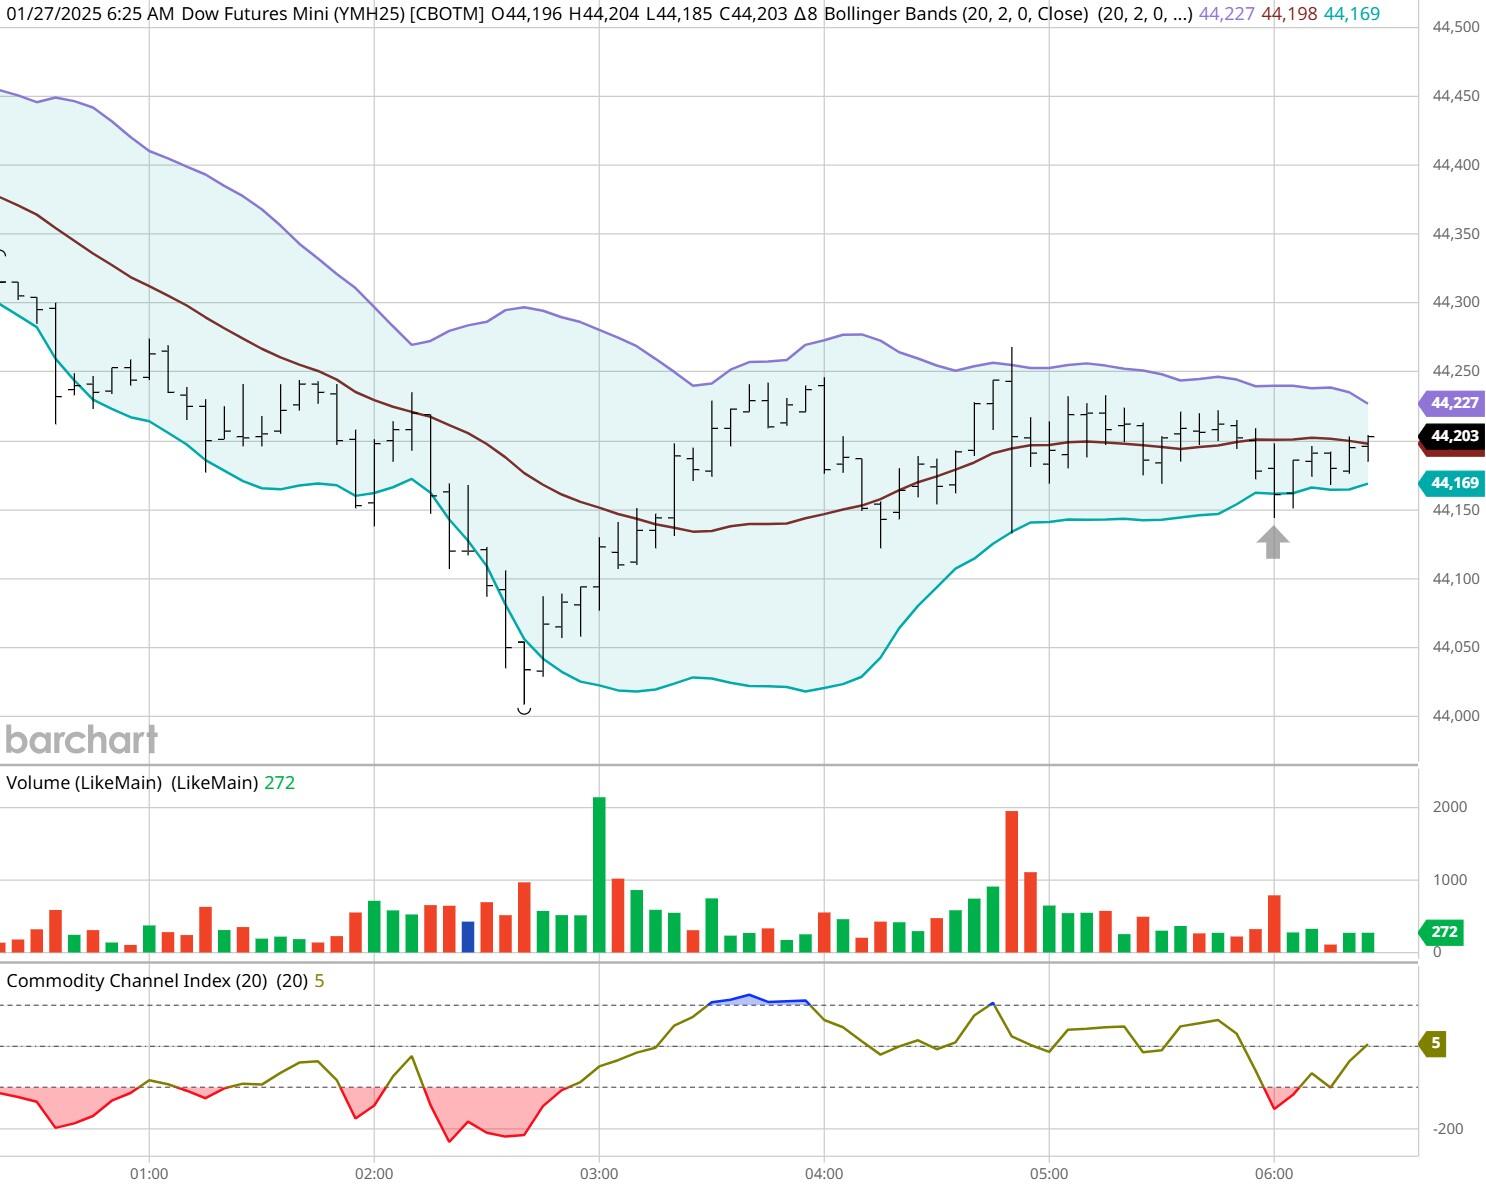
Dow - Mar 2025- 1/27/25
Bias
Yesterday we gave the markets a Neutral or Mixed bias and the markets didn't disappoint. The Dow closed Higher by 289 points, but the other indices closed Lower. The S&P dropped 89 but the Nasdaq fell by 612 points. Today we aren't dealing with a correlated market, and our bias is Neutral or Mixed.
Could this change? Of Course. Remember anything can happen in a volatile market.
Commentary
Yesterday a Chinese AI company called DeepSeek sent fear throughout the markets as they released their latest version of AI that costed only a fraction on what the major companies in the US have planned to spend on AI. This company has figured out a way to do more with less and that is always music to Wall Street's ears. Want to learn Market Correlation and determine market direction hours before the Opening Bell?
Author

Nick Mastrandrea
Market Tea Leaves


