USD: Sept '24 is Down at 105.345.

Energies: Aug '24 Crude is Up at 81.93.

Financials: The Sept '24 30 Year T-Bond is Down 36 ticks and trading at 117.06.

Indices: The Sept '24 S&P 500 emini ES contract is 34 ticks Higher and trading at 5530.00.

Gold: The Aug'24 Gold contract is trading Up at 2340.80.  

Initial conclusion

This is not a correlated market.  The USD is Down and Crude is Up which is normal, and the 30 Year T-Bond is trading Down.  The Financials should always correlate with the US dollar such that if the dollar is Higher, then the bonds should follow and vice-versa. The S&P is Higher and Crude is trading Higher which is not correlated. Gold is trading Higher which is correlated with the US dollar trading Down.  I tend to believe that Gold has an inverse relationship with the US Dollar as when the US Dollar is down, Gold tends to rise in value and vice-versa. Think of it as a seesaw, when one is up the other should be down. I point this out to you to make you aware that when we don't have a correlated market, it means something is wrong. As traders you need to be aware of this and proceed with your eyes wide open.   All of Asia traded Higher in the overnight session. Currently all of Europe is trading Higheras well. 

Possible challenges to traders

  • Final Manufacturing PMI is out at 9:45 AM EST.  This is Major.

  • ISM Manufacturing PMI is out at 10 AM EST.  This is Major.

  • ISM Manufacturing Prices is out at 10 AM EST.  This is Major.

  • Construction Spending m/m is out at 10 AM EST.  This is Major.

Traders, please note that we've changed the Bond instrument from the 10 year (ZN) to the 2 year (ZT). They work exactly the same.  

We've elected to switch gears a bit and show correlation between the 10-year Treasury notes (ZN) and the S&P futures contract.  The YM contract is the Dow Jones Industrial Average, and the purpose is to show reverse correlation between the two instruments.  Remember it's likened to a seesaw, when up goes up the other should go down and vice versa.  

Yesterday the ZT migrated Higher at around 8:30 AM EST.  If you look at the charts below the ZT gave a signal at around 8:30 AM and started its Upward climb.  Look at the charts below and you'll see a pattern for both assets. The Dow moved Lower at around 8:30 AM and the ZT moved Higher at around the same time.  These charts represent the newest version of BarCharts and I've changed the timeframe to a 15-minute chart to display better.  This represented a Long opportunity on the 2-year note, as a trader you could have netted about 30 plus ticks per contract on this trade.   Each tick is worth $7.625.  Please note: the front month for ZT is Sept and the Dow is now Sept '24.  I've changed the format to filled Candlesticks (not hollow) such that it may be more apparent and visible.  

Charts courtesy of barcharts

ZT

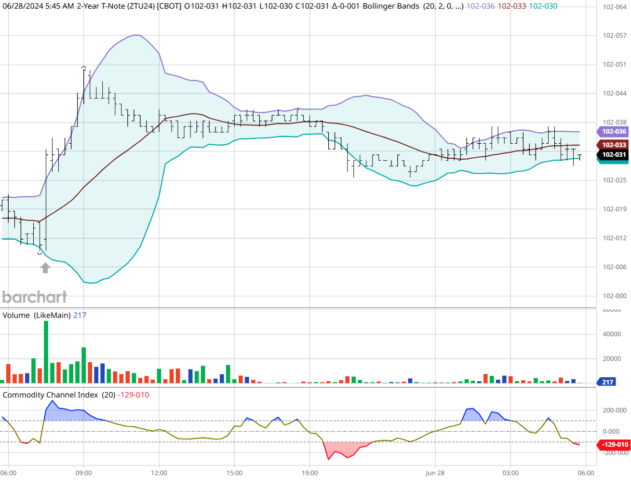
ZT -Sept 2024 - 06/28/24

Dow

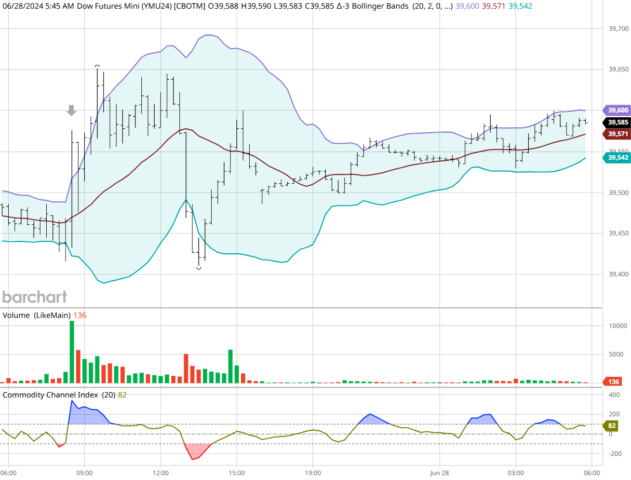
Dow - Sept 2024 - 06/28/24

Bias

On Friday we gave the markets an Upside bias as we saw evidence of Market Correlation Friday morning.  However, the markets had other ideas as the Dow dropped 45 points and the other indices lost ground as well.  Today we aren't dealing with a correlated market and our bias is to the Upside.

Could this change? Of Course. Remember anything can happen in a volatile market. 

Commentary

Friday came and went and the markets apparently weren't enthused with President Biden's delivery Thursday night during the Presidential debate.  On Friday many were calling for the President to step down from the race, that's how bad it was and on Friday evening the New York Times formally suggested that he step down.  It was suggested that Govenor Gretchen Whitmer of Michigan or Gavin Newsome of California take up the reins which of course perturbed VP Harris. Unfortunately, this is a mess and the markets paid for it Friday.  Will we see a return to normalcy today?  As in all things, only time will tell.

Trading performance displayed herein is hypothetical. The following Commodity Futures Trading Commission (CFTC) disclaimer should be noted.

Hypothetical performance results have many inherent limitations, some of which are described below. No representation is being made that any account will or is likely to achieve profits or losses similar to those shown.

In fact, there are frequently sharp differences between hypothetical performance results and the actual results subsequently achieved by any particular trading program. One of the limitations of hypothetical performance trading results is that they are generally prepared with the benefit of hindsight.

In addition, hypothetical trading does not involve financial risk, and no hypothetical trading record can completely account for the impact of financial risk in actual trading. For example, the ability to withstand losses or to adhere to a particular trading program in spite of trading losses are material points which can also adversely affect actual trading results.

There are numerous other factors related to the markets in general or to the implementation of any specific trading program which cannot be fully accounted for in the preparation of hypothetical performance results and all of which can adversely affect actual trading results.

Trading in the commodities markets involves substantial risk and YOU CAN LOSE A LOT OF MONEY, and thus is not appropriate for everyone. You should carefully consider your financial condition before trading in these markets, and only risk capital should be used.

In addition, these markets are often liquid, making it difficult to execute orders at desired prices. Also, during periods of extreme volatility, trading in these markets may be halted due to so-called “circuit breakers” put in place by the CME to alleviate such volatility. In the event of a trading halt, it may be difficult or impossible to exit a losing position.

Recommended Content


Recommended Content

Editors’ Picks

EUR/USD consolidates gains near 1.0750 after US PMI data

EUR/USD consolidates gains near 1.0750 after US PMI data

EUR/USD stays in positive territory at around 1.0750 in the second half of the day on Monday. The US Dollar struggles to find demand following the disappointing ISM Manufacturing PMI data, helping the pair hold its ground ahead of this week's key events.

EUR/USD News

GBP/USD holds above 1.2650 on USD weakness

GBP/USD holds above 1.2650 on USD weakness

GBP/USD clings to daily gains above 1.2650 after starting the week on a bullish note. The renewed US Dollar weakness following the weaker-than-expected PMI data allows the pair to stretch higher during the American trading hours.

GBP/USD News

Gold stabilizes above $2,330 as markets await US data

Gold stabilizes above $2,330 as markets await US data

Gold clings to modest daily gains and fluctuates above $2,330 on the first trading day of the week. The benchmark 10-year US Treasury bond yield stays near 4.4% following last week's rally, limiting XAU/USD's upside ahead of US data.

Gold News

Bitcoin trades above $62,000 on positive on-chain metrics

Bitcoin trades above $62,000 on positive on-chain metrics

Bitcoin price is breaking above the falling wedge pattern on Monday and trades 1% up at the $63,400 level. On-chain data shows a decline in miners' selling activity, positive funding rates, and increasing open interest, suggesting potential price gains in the coming days. 

Read more

Nine fundamentals for the week: Elections, Powell, and the build-up to Nonfarm Payrolls set the tone Premium

Nine fundamentals for the week: Elections, Powell, and the build-up to Nonfarm Payrolls set the tone

Will populists take over? In the UK, the answer is most likely no, but France poses risks to markets. Politics adds spice to an already busy kickoff of the second half of 2024. Here is the preview for this week’s major events.

Read more

Majors

Cryptocurrencies

Signatures