Cycle Trading: Volatile Times

The Dow was down over 3500 points last week.
On Monday, the Dow was up 1293 points.
But on Tuesday the Dow closed down close to 800 points.
Stocks certainly have entered volatile times.
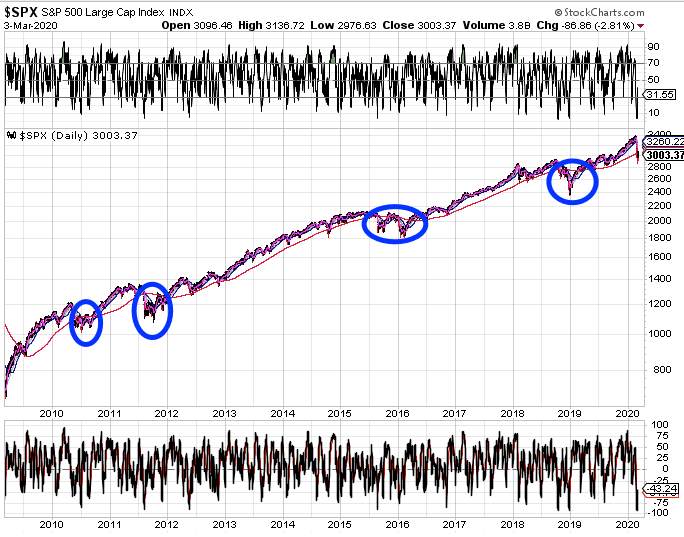
Tonight I want to look back at 4 other volatile times where stocks close convincingly below the 200 day MA.

In 2010, stocks closed convincingly below the 200 day MA on the way to printing the May daily cycle low. The first daily cycle was extremely volatile with stocks being contained by the declining 50 day MA before printing a lower low in late June. During the next daily cycle stocks did break above the 50 day morning average and even managed to close above the 200 day MA. But stocks could not sustain the breakout and ended up printing a higher daily cycle low in August. That set the stage for a sustained break above the 200 day MA in September.
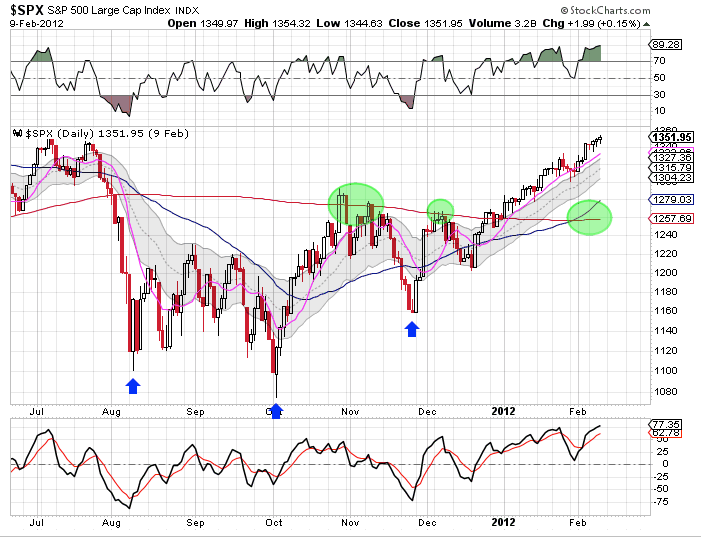
Back in 2011, stocks closed convincingly below the 200 day MA on the way to printing the August daily cycle low. The first daily cycle was extremely volatile with stocks being contained by the declining 50 day MA and ended up printing a lower low in October. During the next daily cycle stocks did break above the 50 day MA and managed to close above the 200 day morning average, but could not sustain the breakout and ended up printing a higher daily cycle low in December. That set the stage for a sustained break above the 200 day MA in January.
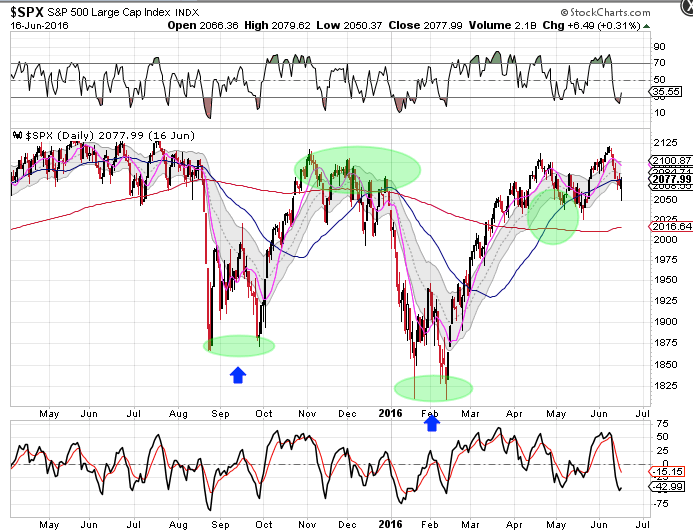
The 2016 low was different than the previous two. Part of the reason for the difference was the Stocks printed a 4 year cycle low in 2016. The previous 2 bottoms that we looked at needed 4 to 5 months before a trending move above the 200 day MA could be sustained. The 2016 bottoming process consisted of two double bottoms and stocks needed 7 months before a break above the 200 day MA could be sustained.
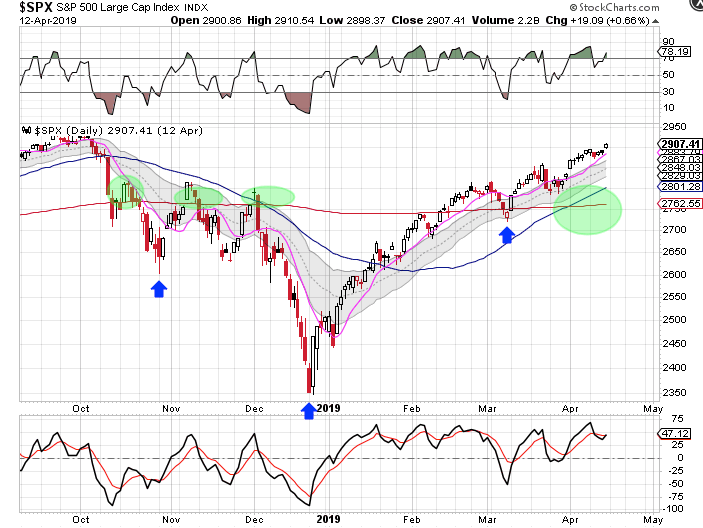
The 2018 low was similar to the 2010 & 2011 lows. In 2018 stocks closed convincingly below the 200 day MA on the way to printing the October daily cycle low. The first daily cycle was extremely volatile with stocks being contained by the declining 50 day MA before printing a lower low in late December. During the next daily cycle stocks did break above the both the 50 day morning average and the 200 day MA. But stocks could not sustain the breakout and ended up printing a higher daily cycle low in March. That set the stage for a sustained break above the 200 day MA in April. And stocks needed bout 4.5 months to complete the bottoming process.
One of the takeaways was that each of the preceding bottoms made a lower low. And the bottoming process lasted 4 to 7 months before a trending move above the 200 day MA could be sustained.
Which brings us to the current chart.
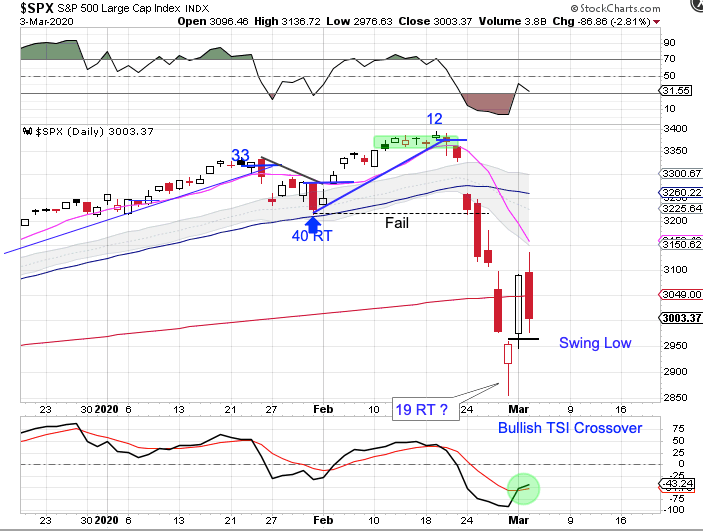
Monday's big gain along with recovering the 200 day MA formed a swing low. So even if Monday was a shortened 17 day, daily cycle low -- stocks will likely be contained by the 50 day MA and will need to print at least one to two daily cycles in order to consolidate the big move down.
Author

LikesMoney
Independent Analyst
Assets (such as stocks, gold, and the dollar) have identifiable cycles.


