Cycle Trading: The Weekend Report Preview

The Dollar
The dollar printed it lowest point on 6/30/17. That was day 28 placing the dollar in its timing band for a DCL.
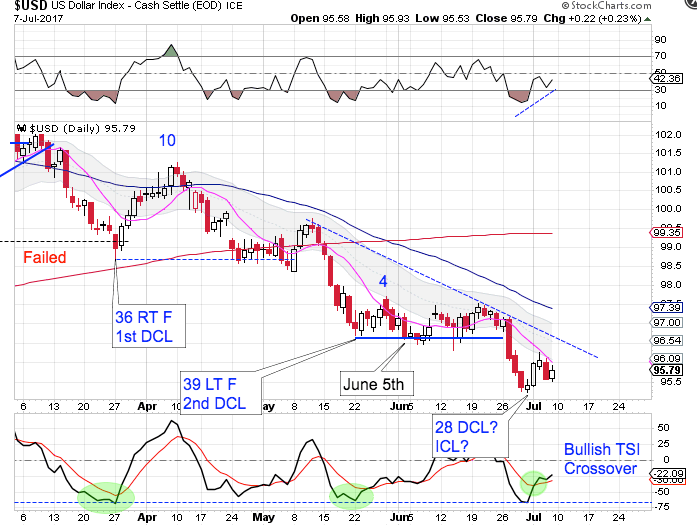
The dollar has formed a swing low off the day 28 low but has been contained by the declining 10 day MA. The dollar will need to close above the 10 day Ma to signal the new daily cycle. A close above the declining trend line will confirm the new daily cycle. The dollar is in a daily downtrend and will continue in its downtrend until it closes above the upper daily cycle band.
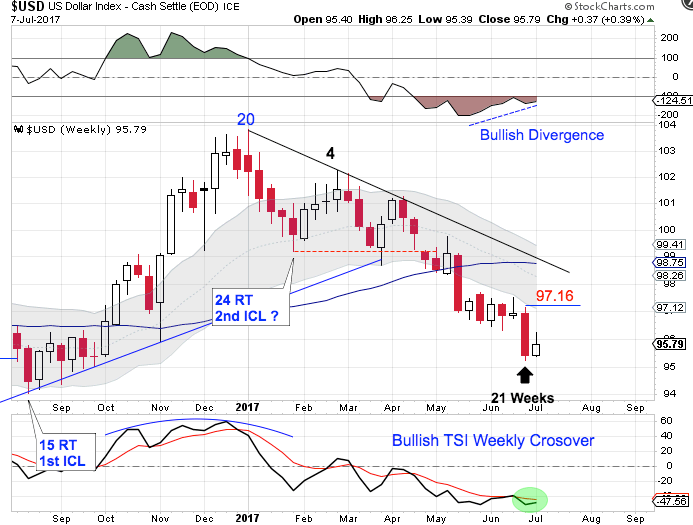
The dollar printed its lowest point on week 21. That places it in its timing band for an ICL. The dollar needs to break above 97.16 to form a weekly swing low to signal a new weekly cycle. The dollar continues to close below the lower weekly cycle band, indicating a weekly downtrend. The dollar will continue in its weekly downtrend until it closes above the upper weekly cycle band.
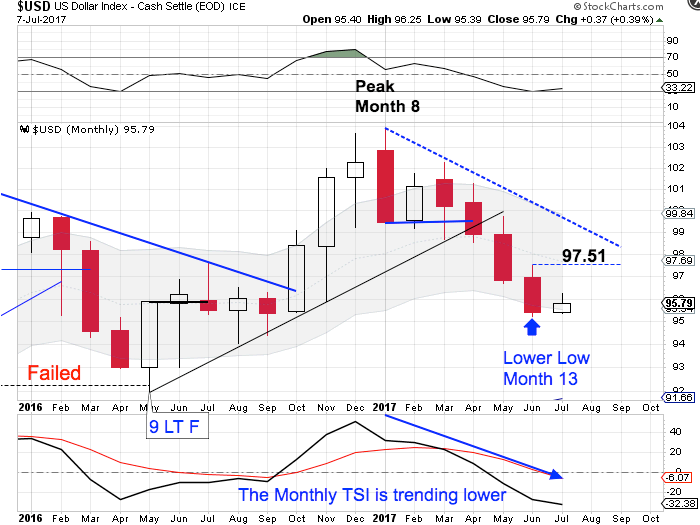
June is month 13, placing the dollar in its timing band to print a yearly cycle low. A monthly swing low is required to form a yearly cycle low. A break above 97.51 would form a monthly swing low.
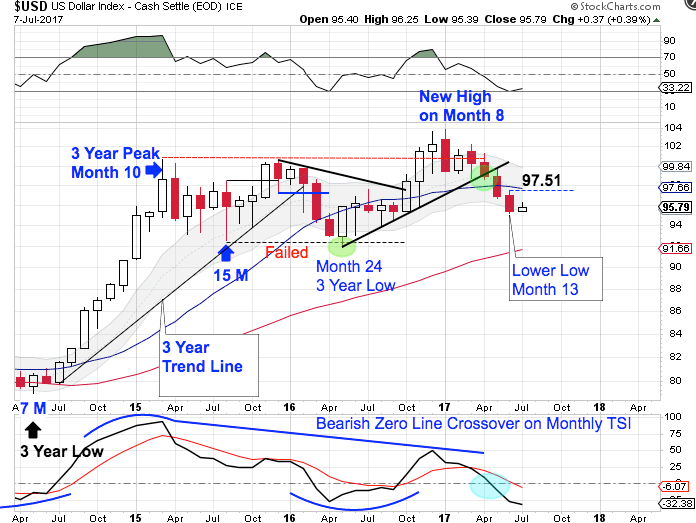
The dollar printed a failed yearly cycle in May, 2016 to confirm the 3 year cycle decline. Then the dollar went on to printed a higher monthly high. Since a cycle cannot fail and then print a higher high, this confirms that May, 2016 was an early 3 year cycle low. That makes July, 2017 month 14 for the new 3 year cycle. The dollar has now broke convincingly below the 3 year trend line, indicating that start of the 3 year cycle decline. If that is the case then the subsequent yearly cycles should form as left translated yearly cycles until the 3 year cycle low forms. And if the 3 year cycle decline has begun, then it is setting up as a left translated 3 year cycle. That aligns with our 15 year super cycle analysis.
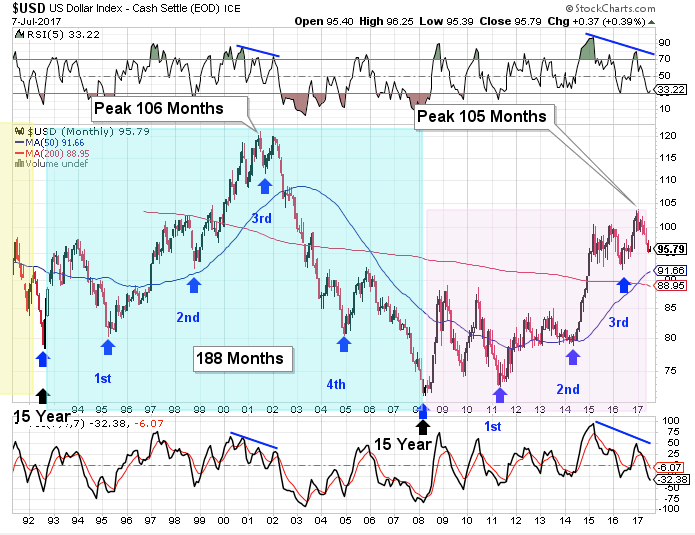
The dollar cycles through a 15 year super cycle. Each 15 year super cycle is embedded with five 3 year cycles. The dollar’s last 15 year super cycle peaked in 2001 on month 106, then declined into its third 3 year cycle low. There are some similarities developing to the current set up. Currently, the dollar has printed a new high in January, which is month 105 for the 15 year super cycle. Which is about when the previous super cycle rolled over into its 15 year super cycle decline. At the previous super cycle peak the dollar was quite stretched above the 200 month MA as well as the 50 month MA — as it is was in January. There are bearish divergences developing on the momentum indicators that also appeared at the previous 15 year super cycle peak.
May, 2016 hosted the 3 year cycle low, which was a shortened 3 year cycle of only 24 months. Since most times cycle balances themselves out, we could be poised for the next 3 year cycle to be a stretched 3 year cycle just as the dollar is ready to begin its 15 year super cycle decline. And a stretched 3 year dollar cycle decline would align with gold beginning a new multi year bull cycle.
Stocks
Stocks printed their lowest point on 6/29, tagging the 50 day MA. That was day 29, placing stocks 1 day shy of its timing band for a daily cycle low.
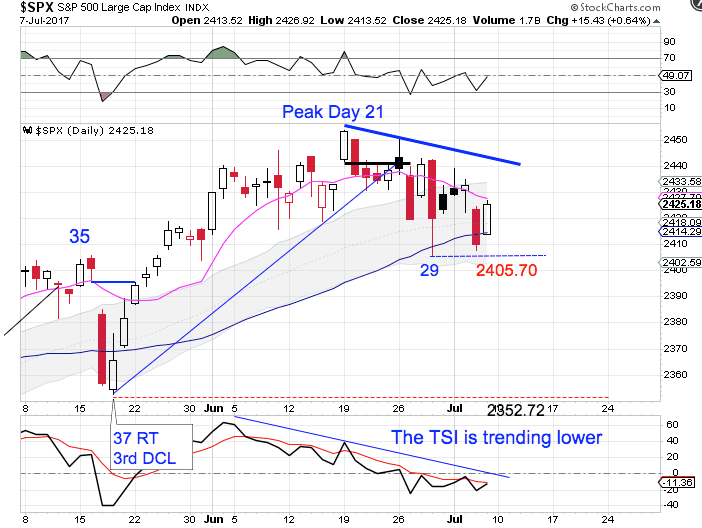
Stocks closed below the 50 day MA on Thursday and rallied on Friday, but was contained by the declining 10 day MA. I think that the close below the 50 day MA makes it more likely to see stocks break below the day 29 low of 2405.70 in order to complete its daily cycle decline. However a break above the day 29 high of 2442.73 would form a daily swing low to signal a new daily cycle. Stocks remain in a daily uptrend. Stocks will continue in their uptrend until it closes below the lower daily cycle band.
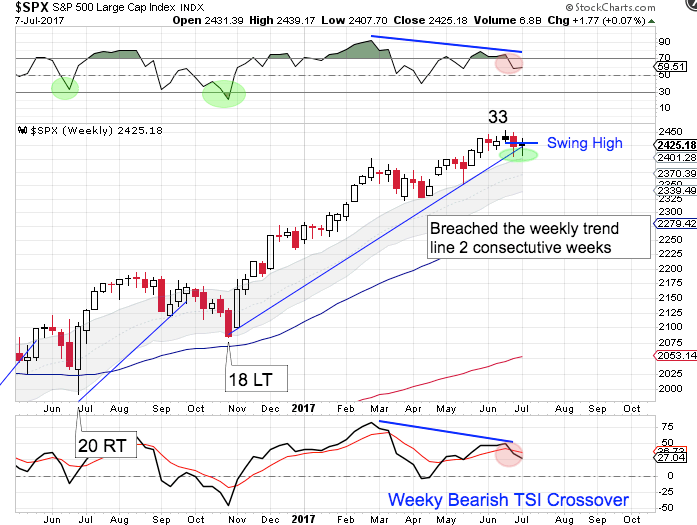
A weekly swing high formed off the week 33 peak. That makes this week 35 for the intermediate cycle. This is a very stretched intermediate cycle. There are bearish divergences developing on the weekly oscillators. All of which signals an imminent intermediate cycle decline. A break of the weekly trend line is required to confirm the intermediate cycle decline. However, stocks remain are in a weekly uptrend. Stocks will continue in its weekly uptrend until it closes below the lower weekly cycle band.
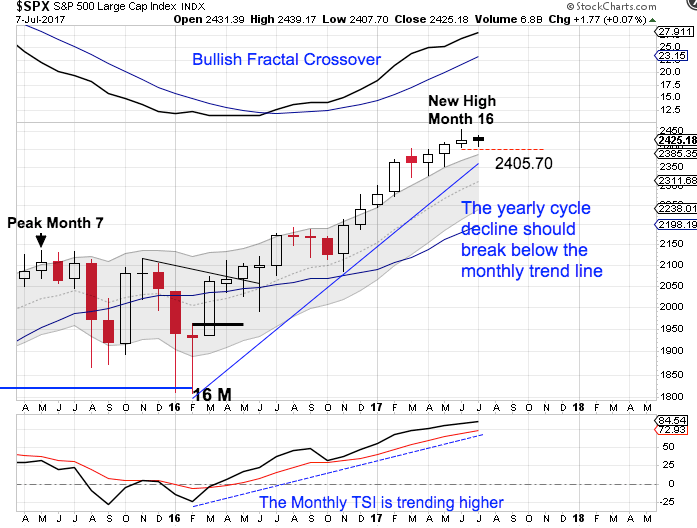
June was month 16 for the yearly equity cycle. The new high in June locks in a right translated yearly cycle formation. Stocks are deep in their timing band for seeking out their yearly cycle low. A monthly swing high accompanied by a break of the monthly trend line will confirm the yearly cycle decline. A break below 2405.70 will form a monthly swing high. So if an intermediate cycle decline is confirmed, it will also indicate that the yearly cycle decline as well.
Author

LikesMoney
Independent Analyst
Assets (such as stocks, gold, and the dollar) have identifiable cycles.


