Currency market: Three-month and 10-year as forecast to recession
Historic evidence suggests 3m trades above 10y = recession in X months or years. I’m not sure the 3m and 10Y forecasts anything as the position of the Fed Funds and Inflation rates must be considered first as both cause the 3m and 10y inversions. The 3m and 10y historically is a late or even no indicator when Fed Funds and Inflation are considered as evidence suggests
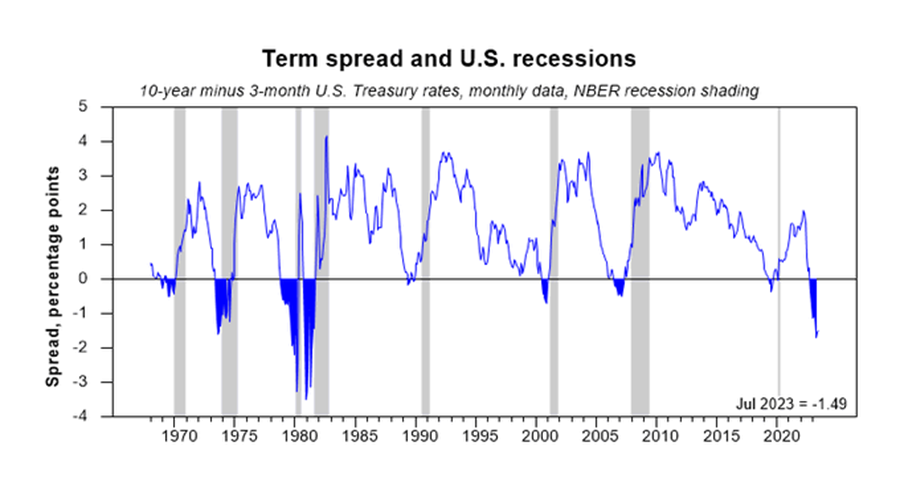
The 3m and 10 year inversions are actually rare events in markets since the 10 year began trading in 1953 as inversion happened in 1973 and 1974 then from 1979 to 1981 or 4 total years. And August – December 2006, January to May 2007 and January 2008.
Historic Inflation was addressed by higher interest rates but the evidence suggest raising interest rates forced inflation higher and prolonged inflation at higher levels. Only when interest rates were lowered, Inflation rates subsided.
The misunderstanding to Inflation and Fed Funds rates is the actual indicator to forecast recessions as NBER outlies recession but no inversions occurred. The 10 and 3 month is viewed as a failure to indicate anything on the horizon.
Charts were derived by fed researcher Arturo Estrella while the data from 1953 to 2010 was obtained from the Fed.
1970 recession
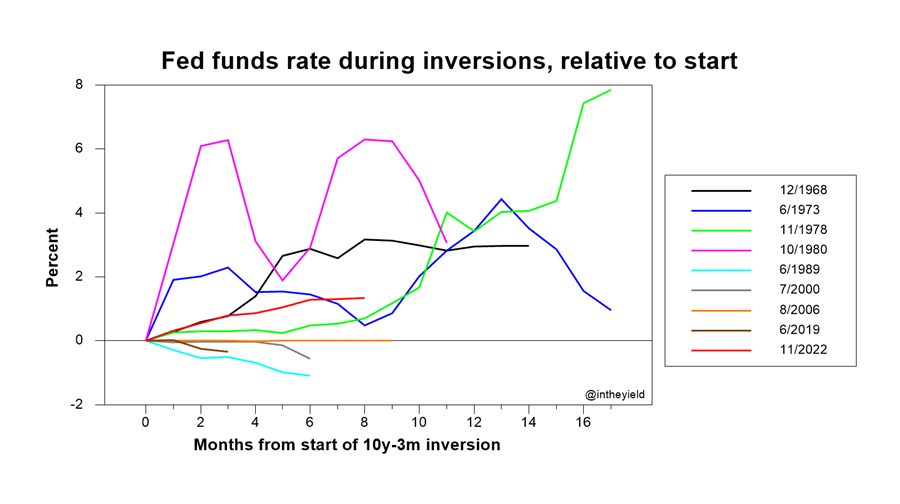
Begin with 1968 = 3m = 5.34 V 10y 5.64. No inversion. Fed Funds rate 1968 = 5.66. Fed Funds 1967 – 1969 = 3.94 – 9.15. Inflation 1967 – 1969 = 2.4 – 5.9.
1969 = 3m = 6.68, 10y = 6.69. No inversion. Fed Funds = 8.21. Inflation = 5.5 average
1970 = 3m = 6.43, 10 y = 7.35. No inversion. Fed Funds = 7.17, Inflation = 5.7 average.
1971 = 3m = 4.35, 10Y = 6.16. No inversion. Fed Funds = 4.67. Inflation = 4.4 average.
1972 = 3m = 4.07, 10y = 6.21. No Inversion. Fed Funds = 4.44. Inflation = 3.2 average.
First Inversion = 1973. Note Fed Funds and Inflation rates. Note the chart 1970 recession. None existed.
1973 = 3m = 7.04, 10y = 6.85. Inversion. Fed Funds = 8.74. Inflation = 6.2 average.
1974 = 3m = 7.89, 10y = 7.56. Inversion. Fed Funds = 10.51. Inflation = 11.0 average.
1975 next recession from charts.
1975 = 3m = 5.84, 10y = 7.99. No inversion. Fed Funds = 5.82. Inflation = 9.1 average.
1976 = 3m = 4.99, 10Y = 7.61. No Inversion. Fed Funds = 5.05. Inflation = 5.8 average.
1977 = 3m = 5.27, 10y = 7.42. No Inversion. Fed Funds = 5.54. Inflation = 6.5 average.
1980 recession. Note again Fed Funds and Inflation Rates.
1978 = 3m = 7.22, 10y = 8.41. No inversion. Fed Funds = 7.94. Inflation = 7.6 average.
1979 = 3m = 10.05, 10y = 9.43. Inversion. Fed Funds = 11.20. Inflation = 11.3 average.
1980 = 3m = 11.51, 10y = 11.43. Inversion. Fed Funds = 13.35. Inflation = 13.5 average.
1981 = 3m = 14.03, 10y = 13.92. Inversion. Fed Funds = 16.39. Inflation = 10.3 average.
1982 = 3m – 10.69, 10y = 13.01. No inversion. Fed Funds = 12.24. Inflation = 6.2 average.
1983 = 3m = 8.62, 10y = 11.10. No inversion. Fed Funds = 9.09. Inflation = 3.2 average.
1984 = 3m = 9.53, 10y = 12.46. No inversion. Fed Funds = 10.23. Inflation = 4.3 average.
Since the 10 year began trading in 1953, and from 1953 – 2010, inversions happened in 4 years = 1973, 1974, 1979 and 1981. And August – December 2006, January to May 2007 and January 2008.
Author

Brian Twomey
Brian's Investment
Brian Twomey is an independent trader and a prolific writer on trading, having authored over sixty articles in Technical Analysis of Stocks & Commodities and Investopedia.


