EUR/USD Current price: 1.1126
View Live Chart for the EUR/USD
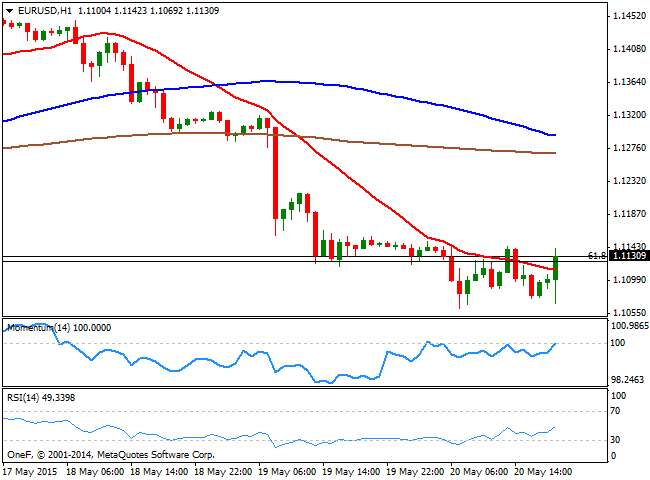
The dollar discretely extended its Tuesday's advance at the beginning of the day, but traded for the most range bound against most of its major rivals until the release of US FOMC Minutes during the American afternoon. The Minutes showed officials seen a rate hike in June as "unlikely," despite believing that the Q1 slowdown was unlikely to persists. FED's members were generally optimistic about the economic outlook, but reaffirmed that the timing for a rate hike will "be determined on a meeting-by-meeting basis and would depend on the evolution of economic conditions and the outlook." Market was actually not expecting a rate hike by June, but the Minutes were seen as dovish, as a weaker USD seems to be supportive of economic growth, which means rates will remain low for longer. At the time of the release, news hit the wires saying that the ECB rose Greek Bank Emergency Cash by €200 million, approving a new limit of €80.2 billion, bringing some relief to EUR buyers.
The EUR/USD pair initially fell towards its daily low established at 1.1061 with the release, but bounced from it and hovers around the 1.1120 level, unable to break above the critical Fibonacci resistance. The short term technical picture shows that the price is barely above a mild bullish 20 SMA whilst the technical indicators head higher below their mid-lines, suggesting the pair may extend its upward correction. In the 4 hours chart however, the 20 SMA maintains a strong bearish slope well above the current level, whilst the technical indicators have barely bounced from extreme oversold levels, keeping the risk towards the downside albeit the limited buying interest around the pair. Nevertheless, a break below former highs in the 1.1050 region is required to confirm a bearish continuation towards the 1.1000 figure.
Support levels: 1.1050 1.1000 1.0960
Resistance levels: 1.1140 1.1170 1.1220
EUR/JPY Current price: 134.63
View Live Chart for the EUR/JPY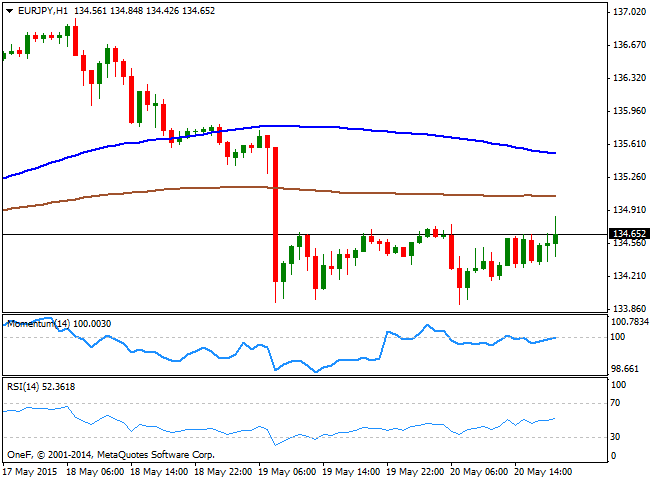
The EUR/JPY is ending the day practically unchanged in the 134.60 region, albeit the cross managed to post a lower low daily basis, at 133.90. The Japanese yen saw a limited advance as Japanese GDP in the Q1 grew above expected, reaching 2.4%, but the yen failed to sustain gains, and EUR weakness kept the pair subdued. Technically, the 1 hour chart shows that the price remains below its 100 and 200 SMAs, with the largest offering an immediate intraday resistance around 135.00. The technical indicators in the same time frame recovered up to their mid-lines where they stand now flat, reflecting little buying interest around the pair. In the 4 hours chart the price moves back and forth around a still bullish 100 SMA, whilst the technical indicators recovered from oversold territory, but lost upward strength well into negative territory, supporting additional declines on renewed slides below the 134.00 level.
Support levels: 134.00 133.60 133.20
Resistance levels: 135.00 135.55 136.10
GBP/USD Current price: 1.5541
View Live Chart for the GBP/USD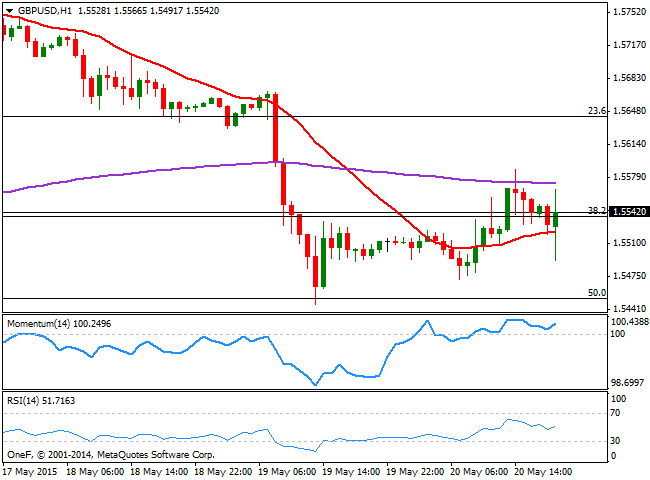
The GBP/USD pair traded as low as 1.5471 in the European session, before the release of BOE's Minutes showing MPC members voted unanimously to keep the current economic policy unchanged, whilst they believe the economic slowdown will probably be over within a year. The only negative tone of this mostly hawkish statement was related to the housing sector, as officers suggested rising prices will be closely watched by the Central Bank. The pair managed to post a daily high of 1.5587, but retreated, trading now around the 1.5540 Fibonacci level, the 38.2% retracement of the bullish rally between 1.5088 and 1.5814. The short term picture is mild bullish, as the price holds above its 20 SMA whilst the technical indicators aim higher above their mid-lines. In the 4 hours chart, however, the technical indicators are losing their upward strength well below their mid-lines whilst the 20 SMA maintains a strong bearish slope in the 1.5600 price zone, whilst the 23.6% retracement of the mentioned rally stands around 1.5620, all of which suggests only a recovery above this last will signal a recovery of the British Pound.
Support levels: 1.5500 1.5450 1.5410
Resistance levels: 1.5585 1.5620 1.5660
USD/JPY Current price: 121.11
View Live Chart for the USD/JPY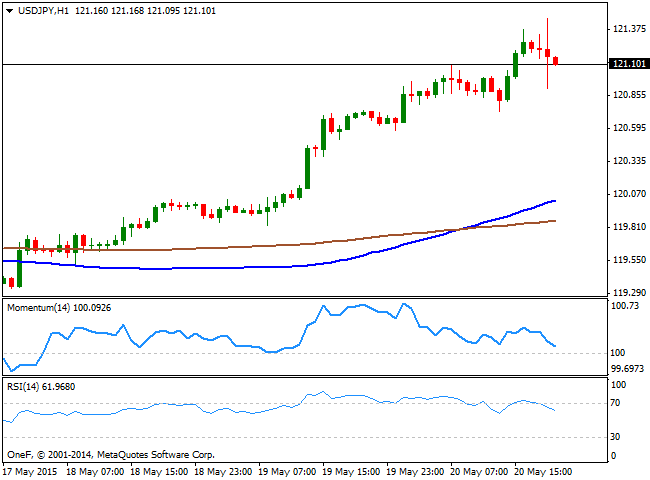
The release of the FOMC Minutes helped the USD/JPY pair reached a fresh 2-month high of 121.46, although the pair retraced some afterwards, consolidating, however above the 121.00 level. The strong advance of these last few days was supported by fresh all-time highs in stocks, and extended despite Wednesday's limited volume in equity trading. Technically, the 1 hour chart shows that the price continues to develop well above its moving averages, whilst the technical indicators head lower towards their mid-lines, and a clear bearish divergence in the Momentum indicator, yet to be confirmed. In the 4 hours chart, the technical indicators are losing their upward strength in extreme overbought levels, supporting a bearish corrective movement towards the 120.45 level. Nevertheless, as long as the price holds above this last level, the upside will remain favored, with scope to retest the year high around 122.00 on a break above the mentioned daily low.
Support levels: 120.85 120.45 120.10
Resistance levels: 121.45 121.70 122.10
AUD/USD Current price: 0.7905
View Live Chart for the AUD/USD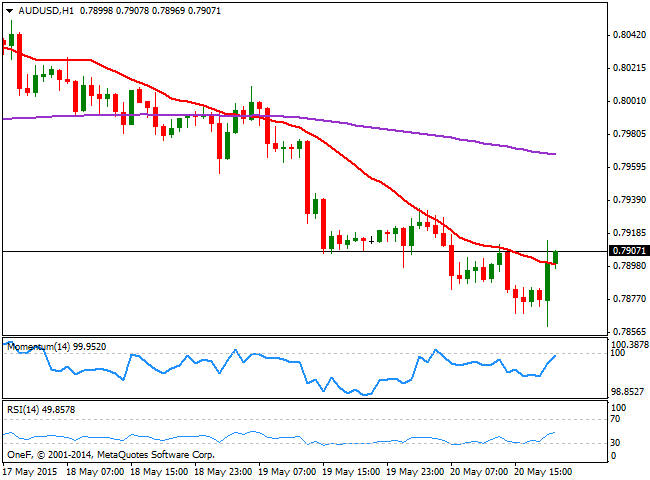
The Australian dollar fell down to 0.7860 against the greenback, before bouncing back now struggling to regain the 0.7900 level. The pair is however positioned to close its fifth day in a row in the red, on the back of the open possibility of further rate cuts coming from the RBA, fueled by the latest Central Bank statement. Technically, the 1 hour chart shows that the price is trying to advance above a bearish 20 SMA, while the technical indicators remain below their mid-lines. In the 4 hours chart, the 20 SMA presents a bearish slope, offering dynamic resistance around 0.7950 while the technical indicators lack directional strength deep into negative territory. The price has tried to break below 0.7880, its 200 EMA in this last time frame, but so far the dynamic support has held. Nevertheless, renewed selling interest below this level should lead to a stronger bearish continuation towards the 0.7810 price zone.
Support levels: 0.7880 0.7845 0.7810
Resistance levels: 0.7940 0.7990 0.8030
Recommended Content
Editors’ Picks

AUD/USD: The hunt for the 0.7000 hurdle
AUD/USD quickly left behind Wednesday’s strong pullback and rose markedly past the 0.6900 barrier on Thursday, boosted by news of fresh stimulus in China as well as renewed weakness in the US Dollar.

EUR/USD refocuses its attention to 1.1200 and above
Rising appetite for the risk-associated assets, the offered stance in the Greenback and Chinese stimulus all contributed to the resurgence of the upside momentum in EUR/USD, which managed to retest the 1.1190 zone on Thursday.

Gold holding at higher ground at around $2,670
Gold breaks to new high of $2,673 on Thursday. Falling interest rates globally, intensifying geopolitical conflicts and heightened Fed easing bets are the main factors.

Ethena Labs launches new UStb stablecoin backed by BlackRock's BUIDL token
Ethena Labs announced on Thursday that it has released a new stablecoin product, UStb. The new stablecoin will be fully collateralized by BlackRock's USD Institutional Digital Liquidity Fund and function similarly to a traditional stablecoin.

RBA widely expected to keep key interest rate unchanged amid persisting price pressures
The Reserve Bank of Australia is likely to continue bucking the trend adopted by major central banks of the dovish policy pivot, opting to maintain the policy for the seventh consecutive meeting on Tuesday.

Five best Forex brokers in 2024
VERIFIED Choosing the best Forex broker in 2024 requires careful consideration of certain essential factors. With the wide array of options available, it is crucial to find a broker that aligns with your trading style, experience level, and financial goals.