EUR/USD Current price: 1.0565
View Live Chart for the EUR/USD
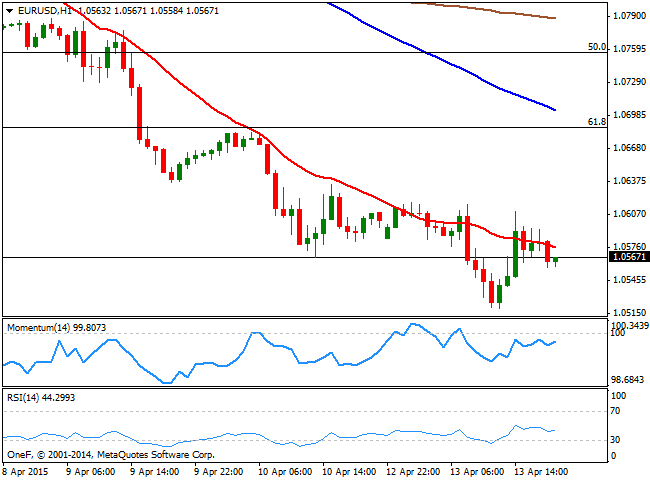
The American dollar started the day with a strong footing this Monday, albeit ended the day up mixed across the board. There were no relevant macroeconomic releases in Europe or the US, but indeed market did not miss headlines to trigger moves. Starting in the Asian session, the Chinese trade balance came out at $3.08B over 10 times less than the expected $45.35B, as both, exports and imports tumbled, 14.6% and 12.3% respectively, boosting the greenback. The EUR/USD pair sunk early Europe to a daily low of 1.0519 from where the pair bounced sharply towards the 1.0600, being limited by selling interest around this last. Later on in the day, market rumors on a Greek default by the ends of this month, should the country fail to reach an agreement with the IMF, kept the pair in the red. On Tuesday, the fundamental calendar will kick start the week with plenty of data, starting with the EZ industrial production figures, German wholesale price index, and inflation figures for Italy and Spain.
In the meantime, the EUR/USD technical picture continues to favor the downside, as the 1 hour chart shows that the price stands below a bearish 20 SMA, while the technical indicators stand directionless below their mid-lines, after correcting oversold readings. In the 4 hours chart the 20 SMA extended further lower above the current level, whilst the technical indicators have recovered from oversold levels, but remain in negative territory, showing limited scope towards the upside. Renewed selling interest below the 1.0550 level should see the pair extending its decline towards fresh lows near the year one in the 1.0460 price zone.
Support levels: 1.0550 1.0520 1.0490
Resistance levels: 1.0600 1.0640 1.0685
EUR/JPY Current price: 126.82
View Live Chart for the EUR/JPY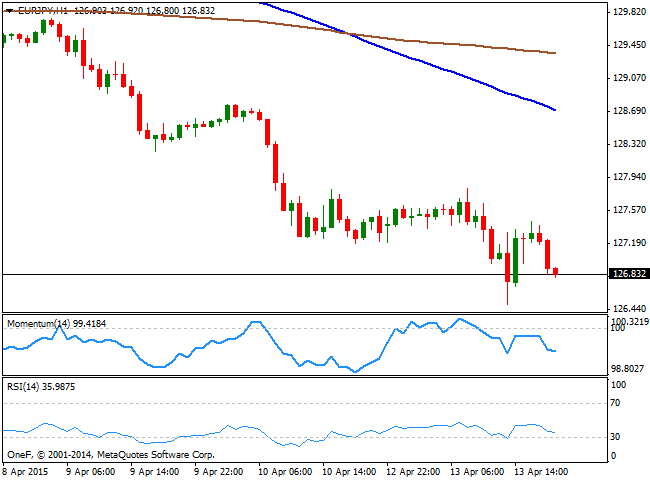
The Japanese yen advanced sharply at the beginning of the US session, following comments from PM Abe's advisor Koichi Hamada, who stated that the 105.00 would be the appropriate quotation for the USD/JPY given purchasing power parity. The EUR/JPY cross fell down to 126.50 following the news, fueled by EUR self weakness, from where it posted a limited bounce before resuming its slide. The 1 hour chart shows that the pair maintains a strong short term bearish tone, with the 100 SMA crossing below the 200 SMA above the current level, and the technical indicators heading lower below their mid-lines. In the 4 hours chart, the Momentum indicator aims slightly higher below the current level, whilst the RSI indicator turned lower around 30, all of which favors another leg lower, particularly if the pair extends below the mentioned low.
Support levels: 126.50 126.10 125.60
Resistance levels: 127.20 127.65 128.00
GBP/USD Current price: 1.4673
View Live Chart for the GBP/USD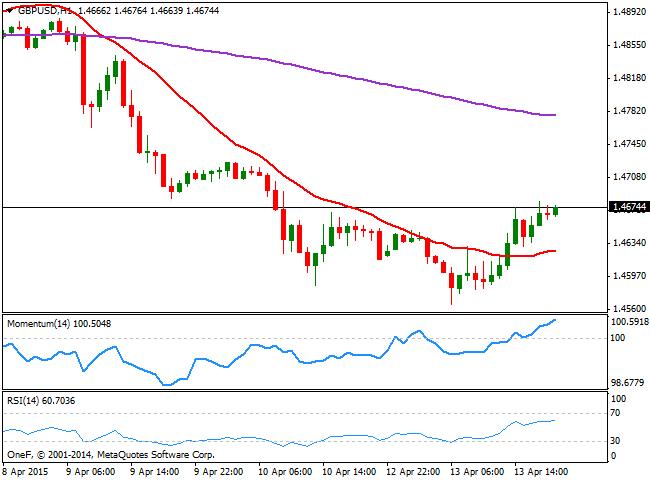
The GBP/USD pair posted a fresh multi-year low of 1.4565 at the beginning of the European session, drove by broad dollar demand from where the pair bounced to close the day into the green and at a daily high in the 1.4670 region. The UK will release several inflation-related figures on Tuesday, expected overall weak, which therefore should prevent the British Pound from advancing further. The short term picture favors the upside, as the 1 hour chart shows that the price advanced its 20 SMA that slowly grinds higher, whilst the Momentum indicator heads north well above the 100 level, and the RSI also advances around 60. In the 4 hours chart the 20 SMA heads strongly lower, offering now dynamic resistance around 1.4710, whilst the indicators bounced sharply from oversold levels, but remain in negative territory. If the price manages to advance above the mentioned 1.4710 level, the pair could extend towards next resistance, formed by former intraday lows in the 1.4750 price zone, while only beyond this last the pair can recover its upward potential for the upcoming sessions.
Support levels: 1.4635 1.4585 1.4550
Resistance levels: 1.4710 1.4750 1.4790
USD/JPY Current price: 120.04
View Live Chart for the USD/JPY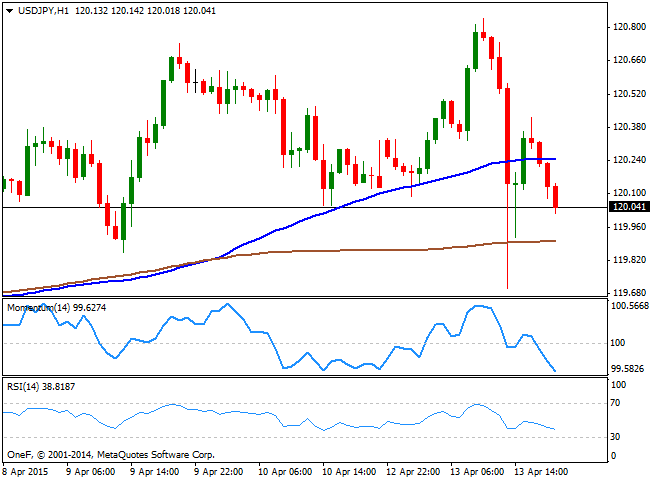
The USD/JPY pair reached a fresh 4-week high of 120.85, before turning south, sinking to a daily low of 119.70 after Abe's advisor comments. The pair however, managed to regain the 120.00 figure quite fast afterwards, but was unable to attract buyers during the American session, ending the day around the critical figure. Technically the 1 hour chart shows that the price stands below its 100 SMA, whilst the technical indicators maintain their strong bearish slopes well into negative territory, keeping the risk towards the downside. In the 4 hours chart the price is back hovering around its moving averages that lack directional strength, whilst the technical indicators have crossed their mid-lines to the downside and continue to head lower, supporting the shorter term view. A downward acceleration below the mentioned daily low should favor additional declines towards the 119.00 region.
Support levels: 119.70 119.35 118.90
Resistance levels: 120.45 120.85 121.30
AUD/USD Current price: 0.7585
View Live Chart for the AUD/USD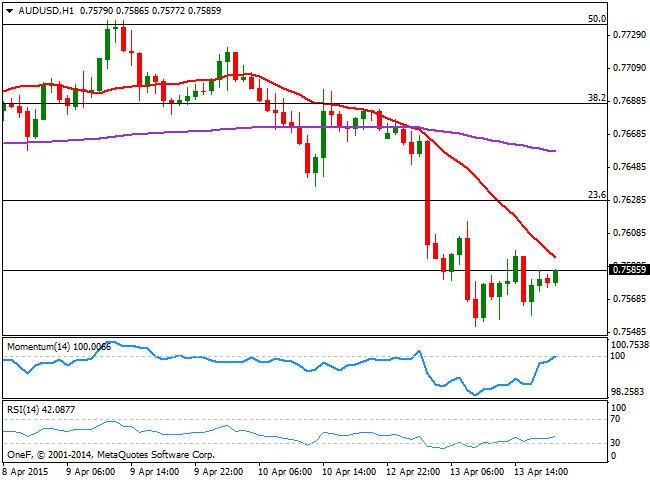
The Australian dollar was hit hard by Chinese trade balance figures, anticipating a weak Q1 GDP in the Asian country. Chinese slowdown usually impacts the Australian dollar, as Australia relies on Chinese demand for its mining products. The AUD/USD fell almost 2%, hitting a daily low of 0.7552, with the posterior recovery being capped by selling interest in the 0.7600 region. During the upcoming Asian session, Australia will release some minor confidence figures, albeit China will be publishing several money-related figures that if weak, may drive the Aussie even lower. Technically, the AUD/USD 1 hour chart shows that the price remains below a strongly bearish 20 SMA, whilst the Momentum indicator retraces from the 100 level, and the RSI hovers around 42. In the 4 hours chart the technical indicators have barely corrected oversold levels before turning flat well into negative territory, all of which keeps the risk towards the downside. The 23.6% retracement of the latest bearish run stands at 0.7625, and as long as below that level, chances of an advance are almost null.
Support levels: 0.7550 0.7520 0.7490
Resistance levels: 0.7625 0.7660 0.7700
Recommended Content
Editors’ Picks

AUD/USD traders seem non-committed around 0.6500 amid mixed cues
AUD/USD extends its consolidative price move just above 0.6500 on Friday. The RBA's hawkish and upbeat market mood supports the Aussie, though mixed Australian PMI prints fail to inspire bulls. Moreover, bets for a slower Fed rate-cut path continue to fuel the post-US election USD rally and cap the currency pair.

USD/JPY slides to 154.00 as higher Japanese CPI fuels BoJ rate-hike bets
USD/JPY languishes near 154.00 following the release of a slightly higher-than-expected Japan CPI print, which keeps the door open for more rate hikes by the BoJ. That said, the risk-on mood, along with elevated US bond yields, could act as a headwind for the lower-yielding JPY and limit losses for the pair amid a bullish USD, bolstered by expectations for a less dovish Fed and concerns that Trump's policies could reignite inflation.

Gold price advances to near two-week top on geopolitical risks
Gold price touched nearly a two-week high during the Asian session as the worsening Russia-Ukraine conflict benefited traditional safe-haven assets. The weekly uptrend seems unaffected by bets for less aggressive Fed policy easing, sustained USD buying and the prevalent risk-on environment

Ethereum Price Forecast: ETH open interest surge to all-time high after recent price rally
Ethereum (ETH) is trading near $3,350, experiencing an 10% increase on Thursday. This price surge is attributed to strong bullish sentiment among derivatives traders, driving its open interest above $20 billion for the first time.

A new horizon: The economic outlook in a new leadership and policy era
The economic aftershocks of the COVID pandemic, which have dominated the economic landscape over the past few years, are steadily dissipating. These pandemic-induced economic effects are set to be largely supplanted by economic policy changes that are on the horizon in the United States.

Best Forex Brokers with Low Spreads
VERIFIED Low spreads are crucial for reducing trading costs. Explore top Forex brokers offering competitive spreads and high leverage. Compare options for EUR/USD, GBP/USD, USD/JPY, and Gold.