EUR/USD Current price: 1.1375
View Live Chart for the EUR/USD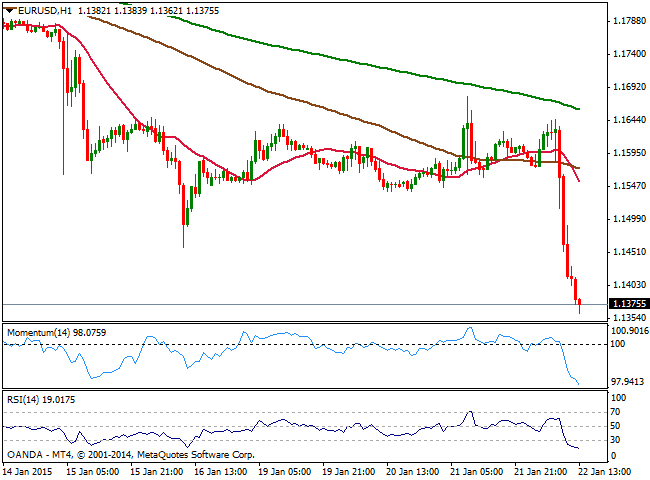
The ECB has finally launched sovereign quantitative easing, in the way of purchases of EUR 60 billion a month beginning in March 2015 until September 2016, of national bonds and agency bonds. The package of over EUR 1T was largely above what market had priced in, but not a surprise after SNB’s move last Thursday, when it decided to lift the EUR/CHF peg. The program is open-ended as according to Draghi, it’s ‘intended to be carried out until end-September 2016 and will in any case be conducted until we see a sustained adjustment in the path of inflation.' The EUR/USD swung in a 120 pips with the news, but as the press conference faded the EUR capitulate against its rivals, falling as low as 1.1362 against the greenback.
Technically, it has accomplished a long term target, as per reaching 1.1370 static support area, where the pair presents several weekly and daily lows back from 2003, so some consolidation at current levels and even a limited bounce, should not be surprise. Short term, the pair is extremely oversold according to technical indicators and with RSI at 18 which supports some upward correction in the near term. In the 4 hours chart indicators maintain a strong upward momentum, not yet ready to turn higher. Nevertheless, this ECB move has somehow reaffirmed the dominant bearish trend, and despite USD longs may be overcrowded, the pair is now set to reach the key psychological figure of 1.10 in the upcoming weeks.
Support levels: 1.1360 1.1330 1.1290
Resistance levels: 1.1420 1.1460 1.1515
EUR/JPY Current price: 134.54
View Live Chart for the EUR/JPY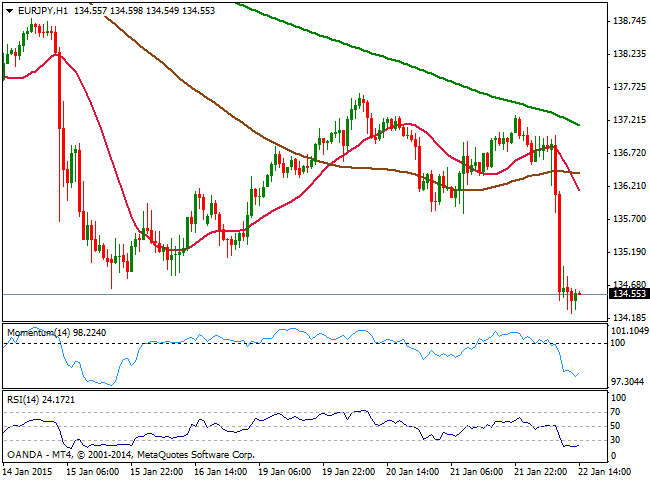
Despite stocks surged with the news, putting the Japanese Yen under pressure, the EUR/JPY cross nose- dived to 134.24, level not seen since last October. Market was all about EUR weakness after the ECB announcement. Technically, the 1 hour chart shows that indicators aim higher in extreme oversold territory, aiming to correct higher, although price consolidates near its lows whilst moving averages are now well above current price. In the 4 hours chart however, indicators are biased strongly down, supporting a continuation of current downward movement, with a break below 134.12, October 2014 low required to confirm an approach to the 130.00 figure.
Support levels: 134.15 133.70 133.35
Resistance levels: 134.90 135.40 135.85
GBP/USD Current price: 1.5021
View Live Chart for the GBP/USD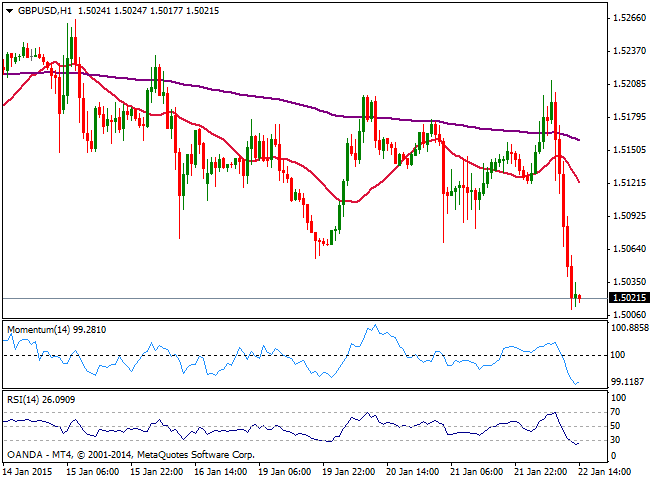
The GBP/USD pair lost over 200 pips this Thursday, having surged early Europe up to 1.5211 before breaking lower. Trading at a fresh 1 and a half year low, early data showed that British government borrowing rose sharply in December, with Britain's headline public borrowing up to 13.1 billion pounds from 10.3 billion pounds a year before. Technically, the 1 hour chart shows price hovering a few pips above the daily low of 1.5010, and with indicators losing their bearish slope in oversold levels, not yet suggesting an upward corrective movement. In the 4 hours chart indicators maintain a clear bearish momentum ahead of Asian opening, supporting a continued slide, particularly on a break below the mentioned daily low.
Support levels: 1.5010 1.4980 1.4950
Resistance levels: 1.5035 1.5080 1.5125
USD/JPY Current price: 118.30
View Live Chart for the USD/JPY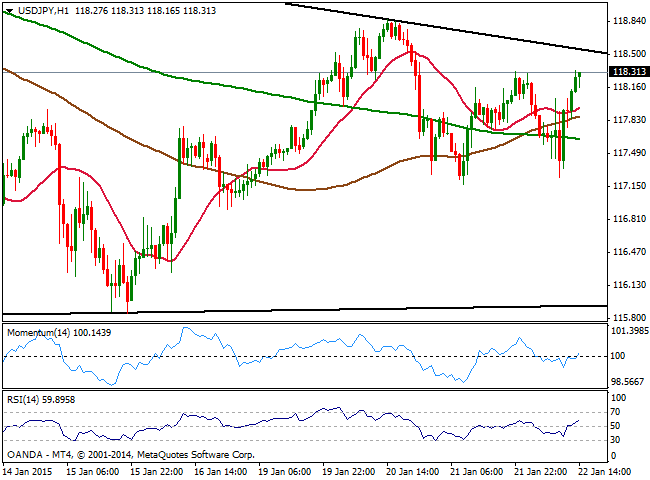
The USD/JPY is sharply higher by US close, trading near its weekly high as dollar index hit a fresh multi-year high following ECBs’ stimulus news above 94.40 mid American afternoon. The stunning recovery in equity markets all over the world also favors the upside in the pair. Asian share markets should also cheer European money injection and remain bid today, meaning the pair will likely continue rising. From a technical point of view and in the short term, the 1 hour chart shows that price is now above their midlines, still in a tight range, whilst indicators crossed their midlines to the upside and continue to head higher, supporting some further advances. In the 4 hours chart technical indicators maintain a neutral stance, while a daily descendant trend line offers immediate resistance around 118.55, the level to overcome to see an extension towards the 119.00 figure.
Support levels: 118.20 117.90 117.45
Resistance levels: 118.60 119.00 119.50
AUD/USD Current price: 0.8060
View Live Chart of the AUD/USD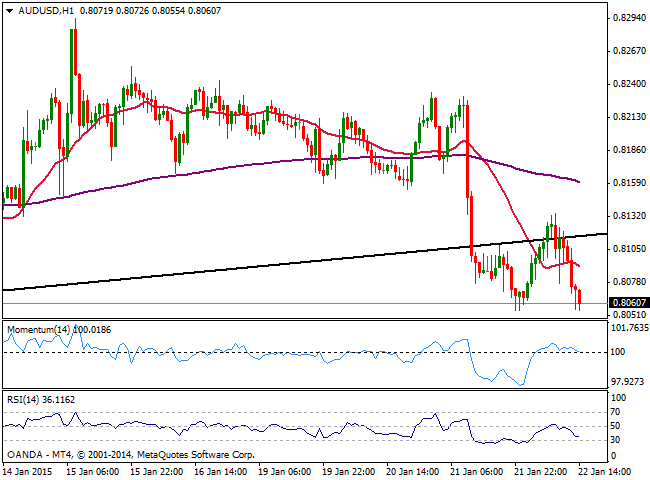
The AUD/USD failed to regain the upside and fell below the 0.8100 figure, trading near its daily low of 0.8055. In Australia, MI Inflation Expectations posted a gain of 3.2%. HIA New Home Sales softened in December, with a gain of 2.2%, while in the US, unemployment claims missed expectations rising to 307K. Data has been quite positive in Australia this week, but not enough to oppose to dollar momentum on Central Bank’s imbalances. The 1 hour chart shows that the price extended below its 20 SMA, whilst indicators turn lower pointing for a break lower. In the 4 hours chart indicators retraced from their midlines, maintaining strong bearish slopes whilst 20 SMA turned lower now offering resistance around 0.8140, all of which supports the shorter term view, particularly following a break below 0.8033 this year low.
Support levels: 0.8035 0.7990 0.7960
Resistance levels: 0.8115 0.8140 0.8190
Recommended Content
Editors’ Picks

AUD/USD: The hunt for the 0.7000 hurdle
AUD/USD quickly left behind Wednesday’s strong pullback and rose markedly past the 0.6900 barrier on Thursday, boosted by news of fresh stimulus in China as well as renewed weakness in the US Dollar.

EUR/USD refocuses its attention to 1.1200 and above
Rising appetite for the risk-associated assets, the offered stance in the Greenback and Chinese stimulus all contributed to the resurgence of the upside momentum in EUR/USD, which managed to retest the 1.1190 zone on Thursday.

Gold holding at higher ground at around $2,670
Gold breaks to new high of $2,673 on Thursday. Falling interest rates globally, intensifying geopolitical conflicts and heightened Fed easing bets are the main factors.

Bitcoin displays bullish signals amid supportive macroeconomic developments and growing institutional demand
Bitcoin (BTC) trades slightly up, around $64,000 on Thursday, following a rejection from the upper consolidation level of $64,700 the previous day. BTC’s price has been consolidating between $62,000 and $64,700 for the past week.

RBA widely expected to keep key interest rate unchanged amid persisting price pressures
The Reserve Bank of Australia is likely to continue bucking the trend adopted by major central banks of the dovish policy pivot, opting to maintain the policy for the seventh consecutive meeting on Tuesday.

Five best Forex brokers in 2024
VERIFIED Choosing the best Forex broker in 2024 requires careful consideration of certain essential factors. With the wide array of options available, it is crucial to find a broker that aligns with your trading style, experience level, and financial goals.