EUR/USD Current price: 1.3394
View Live Chart for the EUR/USD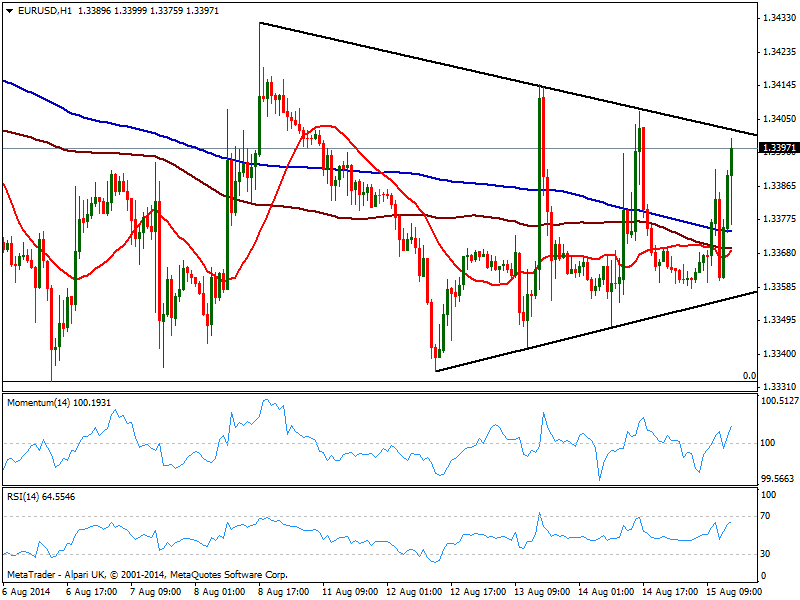
Little happened early Europe with markets closed on holidays, with the EUR/USD trading within familiar levels. With US first batch of data out, the results are a mild negative dollar across the board, as PPI rose 1.7% in July yearly basis, missing expectations, while NY Manufacturing index went down to 14.6. The EUR/USD approaches the 1.3400 level again, with the hourly chart showing price inside a symmetrical triangle with the roof around 1.3402 offering immediate short term resistance. Indicators in the same time frame aim higher above their midlines, while price stands above moving averages, all converging in the 1.3360/70 area, reflecting the lack of clear directional strength. In the 4 hours chart the pair also presents a mild positive tone, yet unless a clear advance beyond 1.3440 buying at current levels remains risky.
Support levels: 1.3370 1.3330 1.3295
Resistance levels: 1.3405 1.3440 1.3485
GBP/USD Current price: 1.6692
View Live Chart for the GBP/USD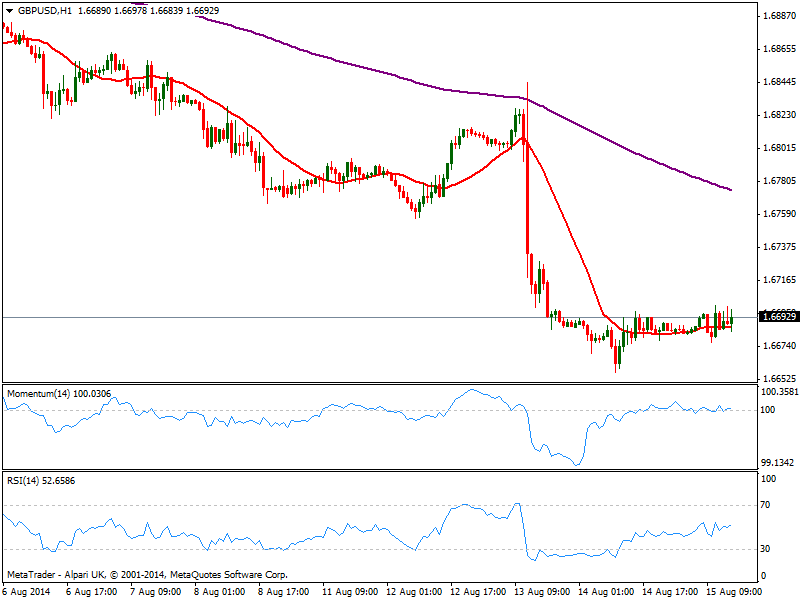
The GBP/USD took the day off, as the pair seems unable to react to news from any of both economies. Earlier on the day, UK quarterly GDP printed 0.8% strongest in nearly 5 years. Nevertheless, the pair maintains a strong neutral technical outlook according to the hourly chart, with price hovering around a flat 20 SMA and indicators laying horizontal around their midlines. In the 4 hours chart the bearish tone prevails, with 20 SMA offering dynamic resistance now around 1.6730 in case the pair finally wakes up.
Support levels: 1.6650 1.6620 1.6580
Resistance levels: 1.6700 1.6730 1.6760
USD/JPY Current price: 102.66
View Live Chart for the USD/JPY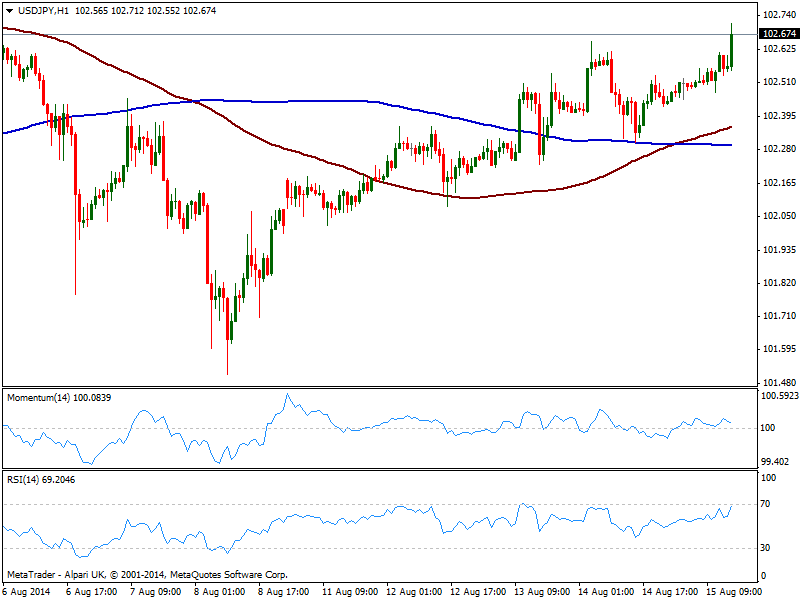
The USD/JPY extends its advance, approaching 102.80 static resistance area albeit still quite limited, considering the weekly range has barely reached 60 pips. Technically, the hourly chart shows price above moving averages, with 100 one above the 200, and indicators holding in positive territory. In the 4 hours chart the technical picture is also bullish, yet unless a clear acceleration above mentioned 102.80 the upside will remain limited.
Support levels: 102.30 101.95 101.60
Resistance levels: 102.80 103.10 103.45
AUD/USD Current price: 0.9312
View Live Chart for the AUD/USD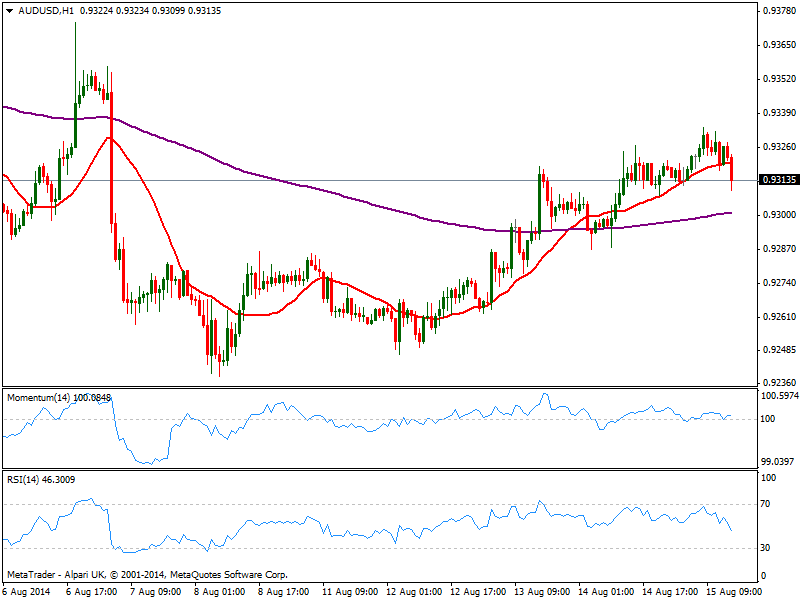
The AUD/USD retraced from a daily high of 0.9333 weighted by a sudden slide in gold, down 15 bucks in an hour. Technically, the hourly chart shows price broke below its 20 SMA as indicators turned lower around their midlines, ready to trigger some bearish signals. In the 4 hours chart technical readings indicators turned lower in positive territory, while 20 SMA maintains a strong bullish slope below current price, currently in the 0.9300 price zone: a break below it should lead to further slides, eyeing then 0.9260 price zone.
Support levels: 0.9300 0.9260 0.9220
Resistance levels: 0.9330 0.9370 0.9410
Recommended Content
Editors’ Picks

AUD/USD: The hunt for the 0.7000 hurdle
AUD/USD quickly left behind Wednesday’s strong pullback and rose markedly past the 0.6900 barrier on Thursday, boosted by news of fresh stimulus in China as well as renewed weakness in the US Dollar.

EUR/USD refocuses its attention to 1.1200 and above
Rising appetite for the risk-associated assets, the offered stance in the Greenback and Chinese stimulus all contributed to the resurgence of the upside momentum in EUR/USD, which managed to retest the 1.1190 zone on Thursday.

Gold holding at higher ground at around $2,670
Gold breaks to new high of $2,673 on Thursday. Falling interest rates globally, intensifying geopolitical conflicts and heightened Fed easing bets are the main factors.

Bitcoin displays bullish signals amid supportive macroeconomic developments and growing institutional demand
Bitcoin (BTC) trades slightly up, around $64,000 on Thursday, following a rejection from the upper consolidation level of $64,700 the previous day. BTC’s price has been consolidating between $62,000 and $64,700 for the past week.

RBA widely expected to keep key interest rate unchanged amid persisting price pressures
The Reserve Bank of Australia is likely to continue bucking the trend adopted by major central banks of the dovish policy pivot, opting to maintain the policy for the seventh consecutive meeting on Tuesday.

Five best Forex brokers in 2024
VERIFIED Choosing the best Forex broker in 2024 requires careful consideration of certain essential factors. With the wide array of options available, it is crucial to find a broker that aligns with your trading style, experience level, and financial goals.