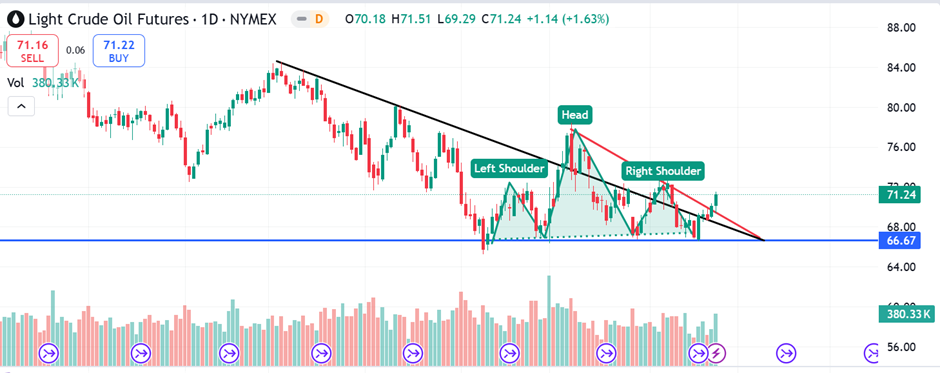
Crude optimism: What’s driving oil markets up?

Crude oil has been recently showing signs of bullish momentum in the market. As we see the bounce from the neck line of head and shoulder pattern. The ways bulls are racting it seems like the bulls will become more aggressive towards north in upcoming days. The latest news suggest that Russia launched ‘a new kind of ballistic missile in to Ukraine’ as a response to Ukraine’s use of US missiles on Russia earlier this week and it rebounded sharply after US PMI shows pickup in ativity. Further supply discruptions cause oil prices to rise further so we will keep an close eye on geopoltical tension. We will keep our view bullish for the Crude oil prices.
Technical analysis
- Moving Averages & RSI: Relative Strength Index (RSI) is moving above the midline zone i.e. on H4 chart.
- 50 EMA:The 50-period Exponential Moving Average (EMA) is acting as support for XAGUSD.
- MACD: The MACD line crossovers, reinforcing the bullish trend though histogram volume is relatively high.
Key support and resistance levels [4-Hourly basis]
- Resistance Levels:
- Immediate resistance is at $72.88-$72.98. A break and sustain above this zone could propel prices toward $74.92-$75.00.
- Support Levels:
- Immediate support is at $69.93-$69.87. A break below this level could trigger a move towards $68.37-$68.22.
Trading Strategy: Based on chart and study above we would suggest to our readers that buy crude oil at current level and convert any dip as a buying opportunity i.e. around $71 target is $73, $75 with tight stop loss of below $69. Traders should be alert for potential breakout opportunities and keep a close watch on upcoming economic data releases, which could drive market volatility.
Author

Harish Shahi
Indian Market View
Harish Shahi did MBA in Energy Trading and he is a seasoned Head of Research in Commodity and Equity Domain. He contributed his view on difference financial news channels like ET Now Swadesh, Zee Business, NDTV Profit .


