Crude Oil: In a trap

Crude oil bounced off the nearest support area, but the way to the higher levels continues to be blocked. What’s next?
Technical picture of Crude Oil
In yesterday’s article on crude oil, you could read the following:
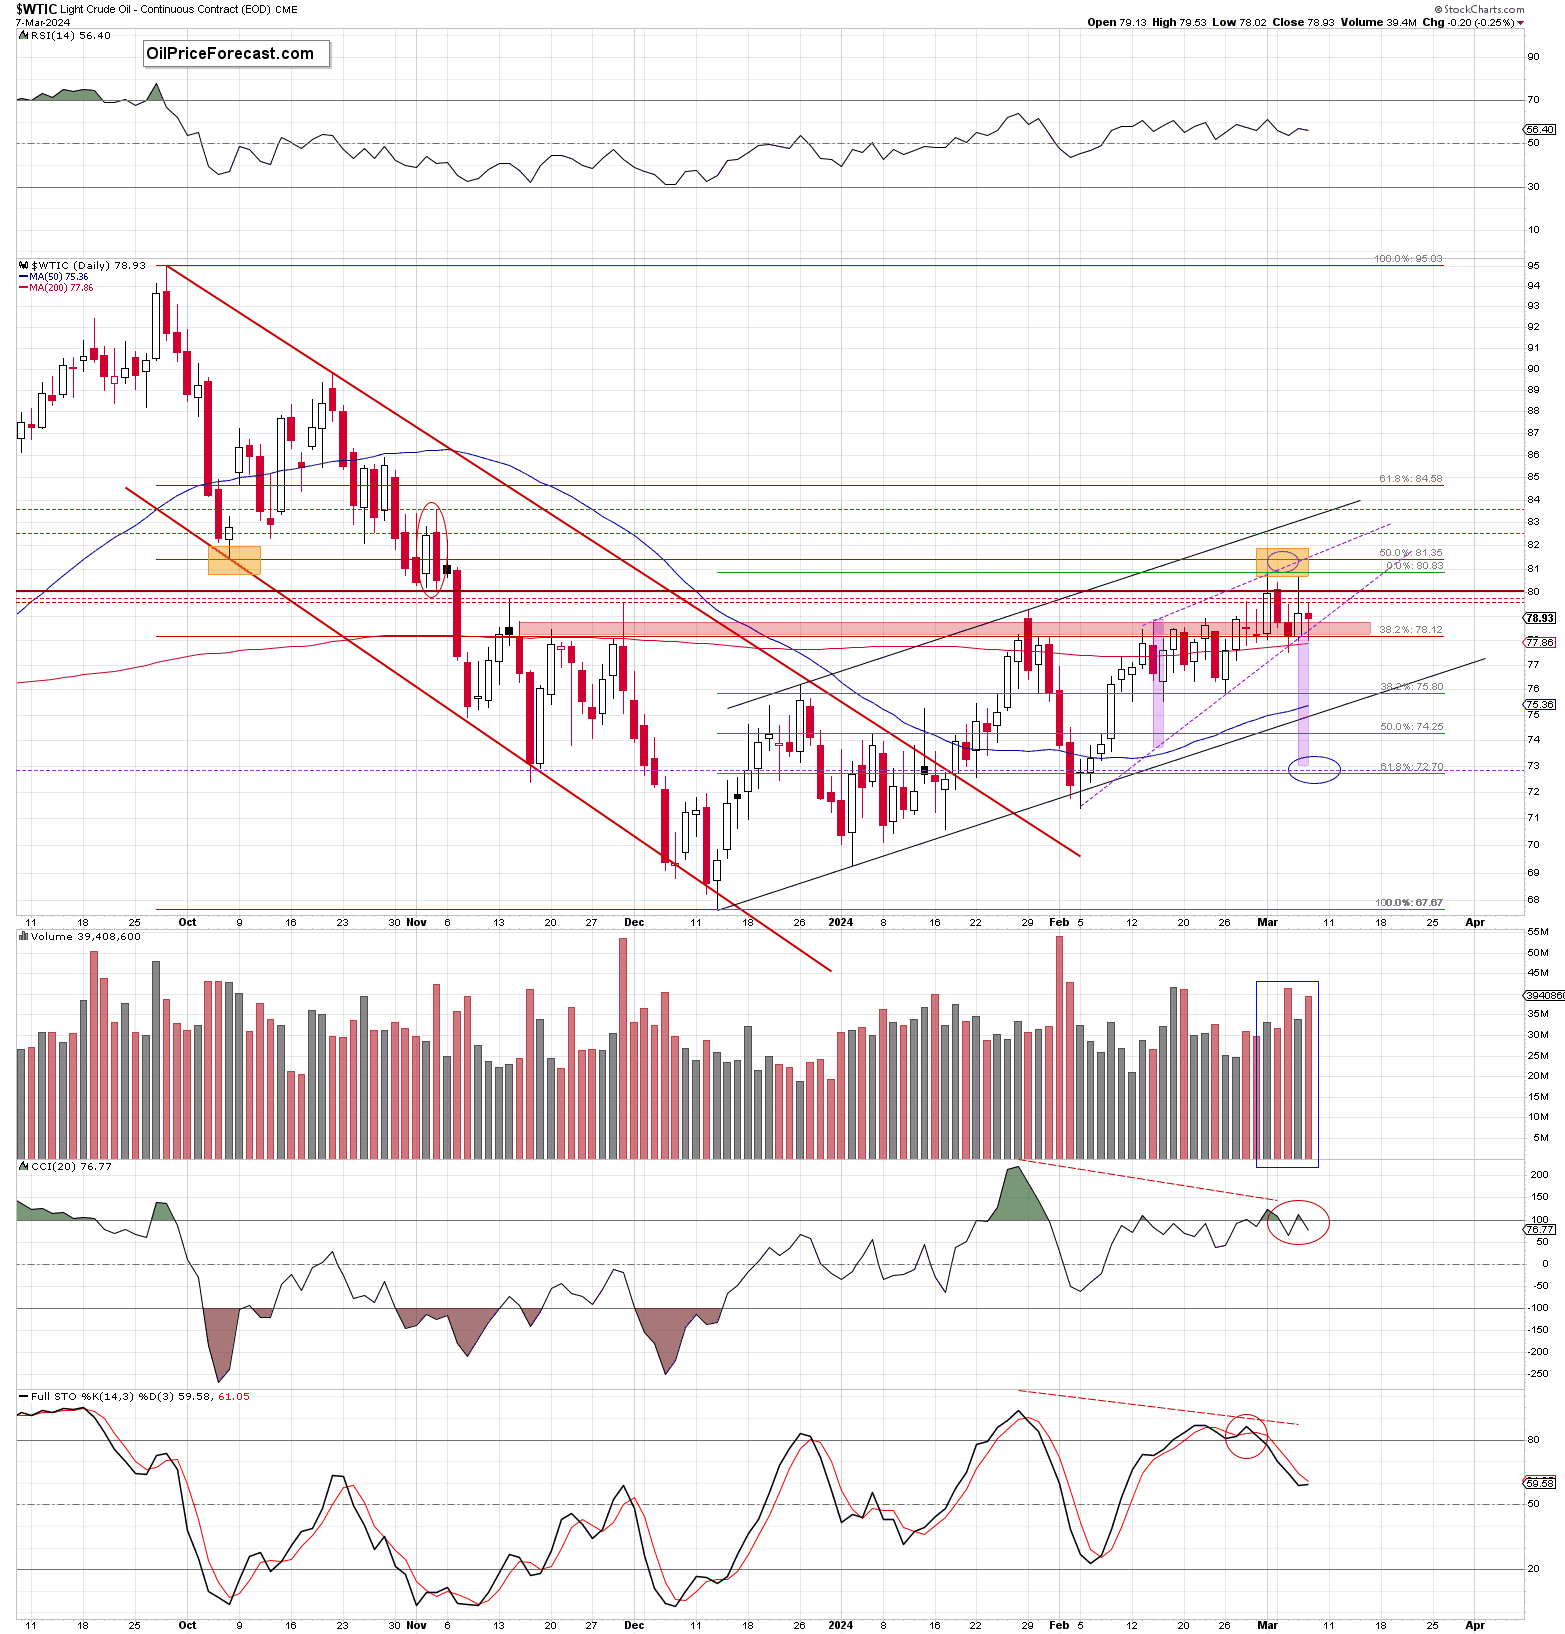
(…) Although black gold hit an intraday high of $80.67, oil bulls didn’t manage to hold gained levels, which caused a pullback that took light crude not only below the barrier of $80, but also under the upper line of the blue channel.
In this way, crude oil invalidated the earlier breakouts, leaving on the chart white candle with a prolonged upper shadow, which confirms oil bears involvement and determination around the mentioned psychologically important level of $80.
Additionally, yesterday’s increase materialized on a visibly lower volume than Tuesday’s decline, which doesn’t bode well for the bulls, signaling that they may not be as strong as it seems at the first glance.
What’s next?
Considering yesterday’s price action and combining it with the sells signals generated by the daily indicators, it seems that further deterioration is just around the corner.
If this is the case, and light crude extends losses from here, the first downside target for the sellers would likely be the lower border of the purple rising wedge (currently at around $78.30) once again.
Looking at the charts, we see that the situation developed in tune with the above scenario and crude oil tested the mentioned downside target during yesterday’s session. Thanks to Thursday’s price action, the commodity lost 0.25%, making our short positions already profitable.
What could we call yesterday's session at first glance?
In short, a repetition of what we saw the day before.
Why?
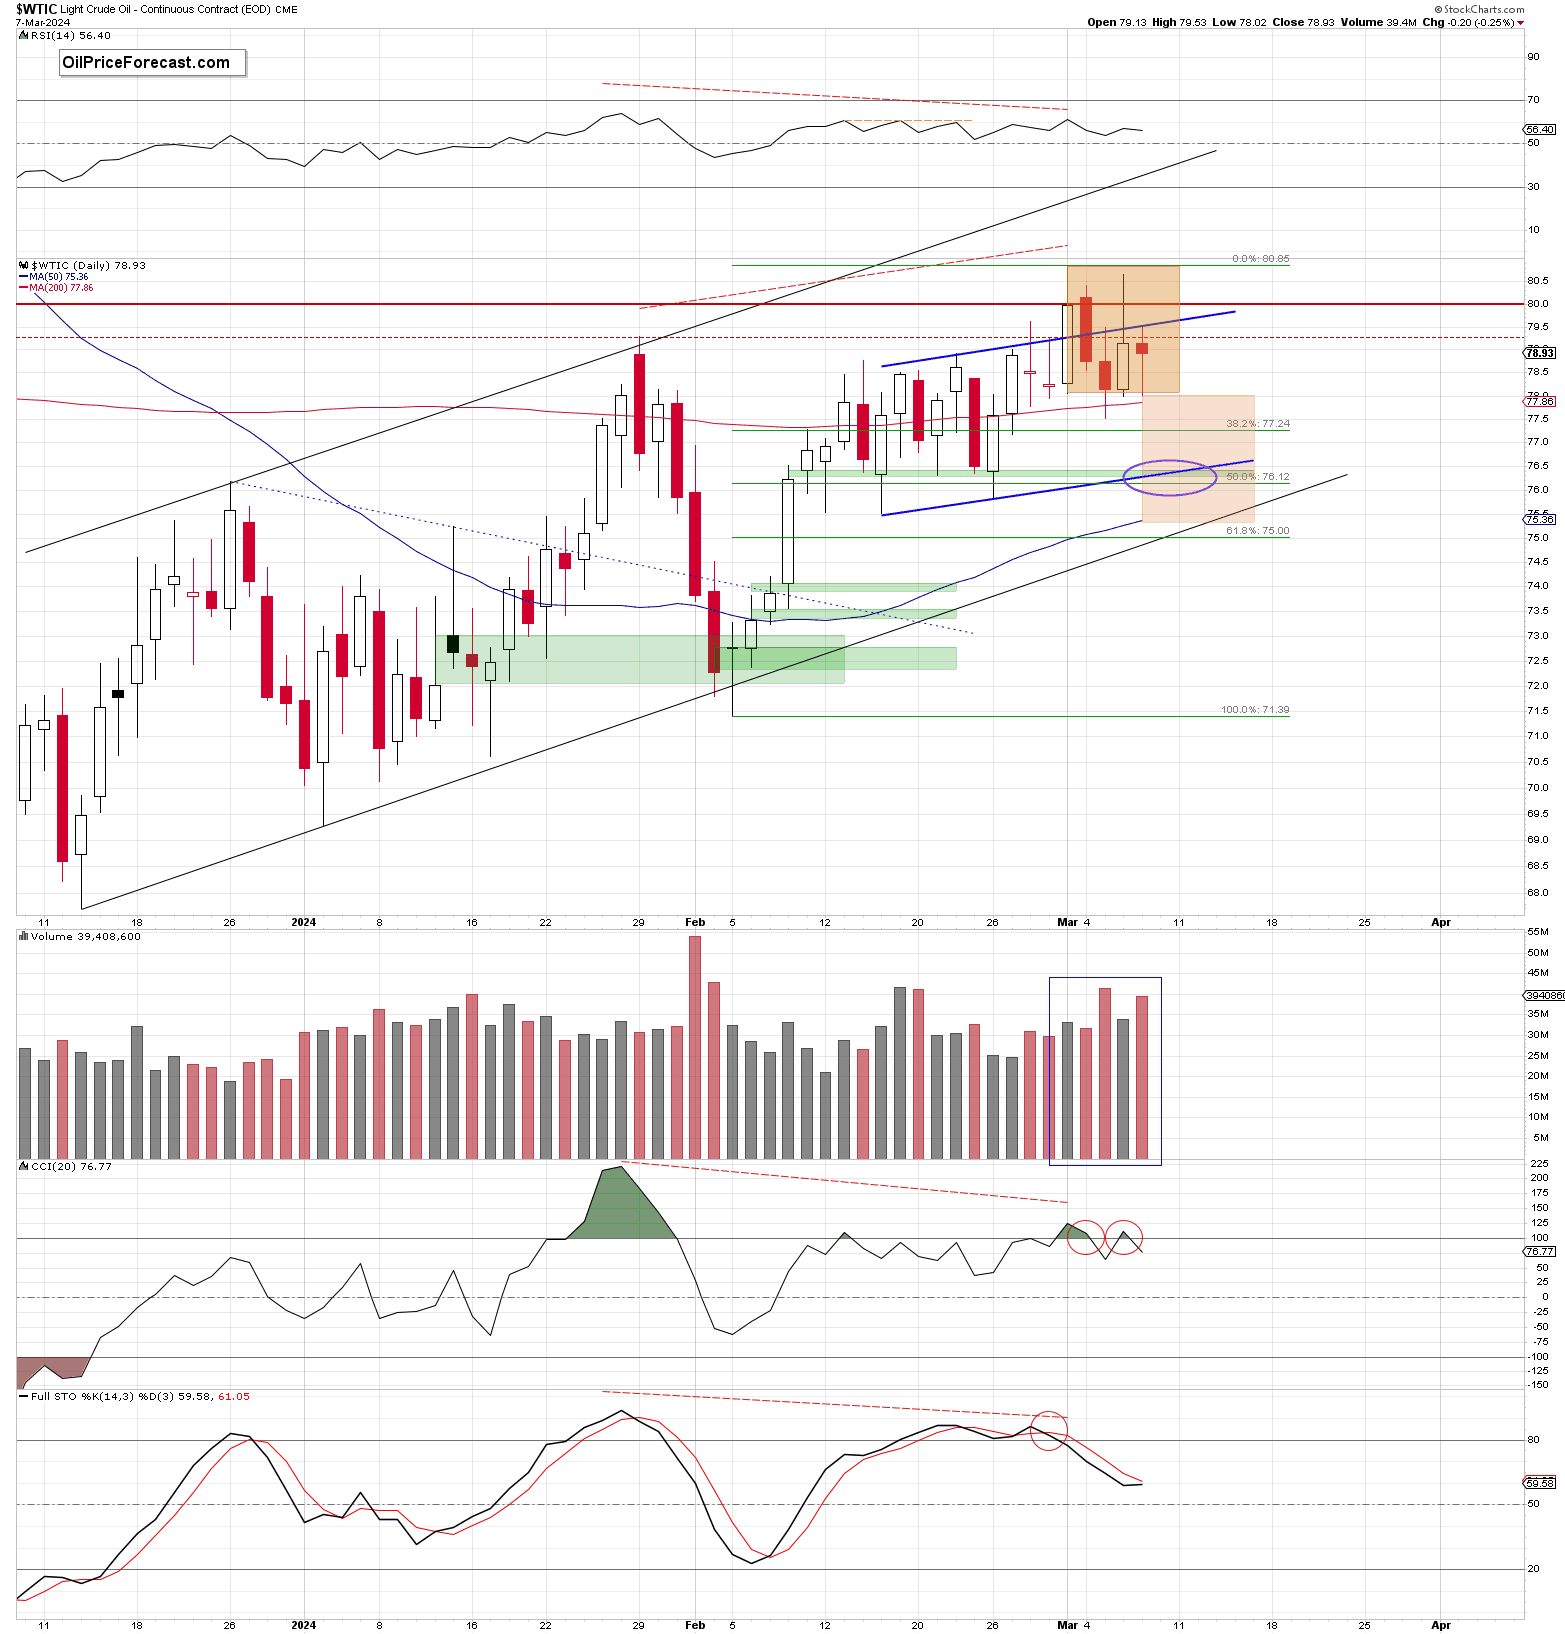
Because crude oil started Thursday’s session at the Wednesday’s closing level (and below the previously broken upper border of the blue channel), which encouraged the bears to test the nearest bulls’ headquarter based on the lower border of the purple rising wedge, the 200-day moving average, the lower border of the orange consolidation (marked on the enlarged chart, about which I will tell you more a bit later in the analysis) and the previously broken red area.
Just like the day before it withstood the selling pressure, which resulted in a rebound and a comeback not only to the opening price, but also in a climb to the upper line of the blue channel.
This time, the buyers didn’t even manage to break above it (not to mention the test of the barrier of $80), which caused a pullback that took the price of black gold under the opening price, making our short positions already profitable.
What’s next?
Considering clearly visible weakness of the bulls and sell signals generated by the indicators, it seems that further deterioration is just around the corner.
If this is the case and the bears manage to push the commodity under the lower border of the orange consolidation (which also corresponds to the above-mentioned bulls’ headquarter), the way to $75.25 (where the size of the downward move would correspond to the height of the formation) will likely be open.
However, before this goal is achieved, sellers will have to overcome an important very short-term support area about which I wrote yesterday:
(…) In my opinion, the next target for the bears would likely be the support area created by the lower border of the blue channel, the 50% Fibonacci retracement (based on the Feb. upward move) and the green supportive gap ($76.22-$76.42).
However… (…) If it is broken, we’ll likely see a test of the 38.2% Fibonacci retracement (based on the entire mid-Dec.-Feb upward move). The next stop for the bears could be the 50-day moving average and the lower border of the black rising trend channel, which are slightly above the 50% Fibonacci retracement.
Summing up, yesterday, we saw another unsuccessful attempt to break above the upper border of the blue channel, which doesn’t bode well for the bulls – especially when we take into account yesterday’s volume and the sell signals generated by the indicators. In other words, it seems that further deterioration is just around the corner.
Want free follow-ups to the above article and details not available to 99%+ investors? Sign up to our free newsletter today!
Want free follow-ups to the above article and details not available to 99%+ investors? Sign up to our free newsletter today!
Author

Anna Radomska
Sunshine Profits
Anna's passion for drawing evolved into a fascination with colorful lines and shapes, which later inspired her interest in the stock market.


