Crude Oil: Gap vs resistance area

On Friday, crude oil extended gains and reached the next upside target. But do bulls have the strength for more?
Technical picture of Crude Oil
On Friday, premium readers could read the following:
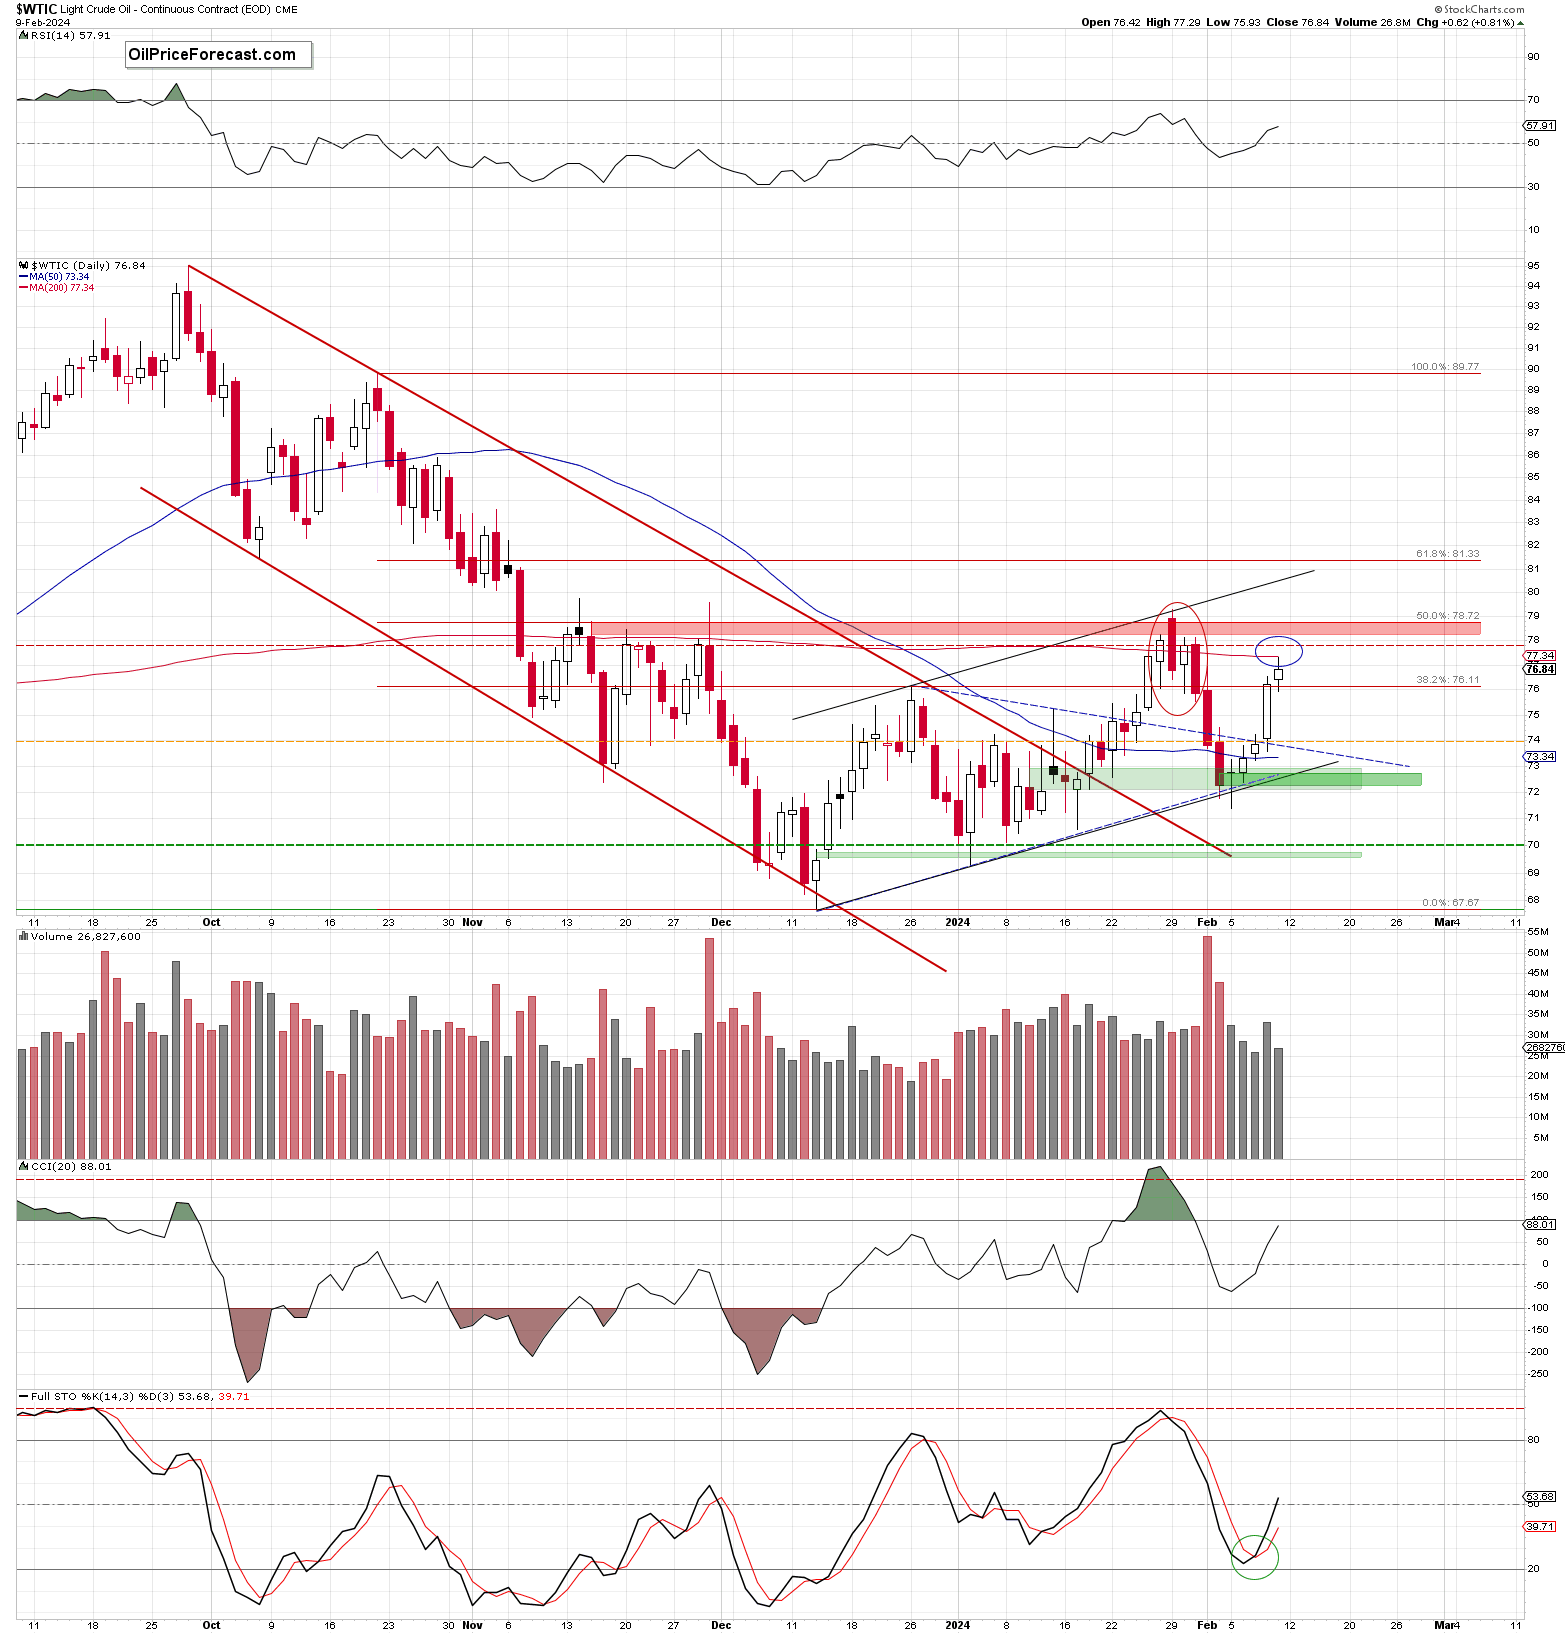
(…) yesterday’s session started with another green gap ($73.86-$74.08), which caused a very significant breakthrough – a breakout above the mentioned nearest resistance zone (created by the Fibonacci retracement, the upper line of the blue triangle and the upper line of the orange consolidation).
(…) As a result, (…) crude oil soared above the 50% Fibonacci retracement and tested the next upside target – the 61.8% Fibonacci retracement.
(…) considering the bulls’ strength after the market open, another green gap, the size of yesterday’s candle (which materialized on higher volume than previous candles) and buy signal generated earlier by the Stochastic Oscillator, it seems that further improvement is likely.
If this is the case and light crude extends gains, the next target for the bulls may be the next resistance zone marked with the red ellipse on the chart (…) it is created by the 200-day moving average (currently at $77.34), the bearish engulfing pattern from Jan.31, and the 78.6% Fibonacci retracement based on the entire Jan.-Feb. downward move.
From today’s point of view, we see that the situation developed in tune with this pro-growth scenario, and oil bulls tested the above-mentioned resistance zone.
But what happened before?
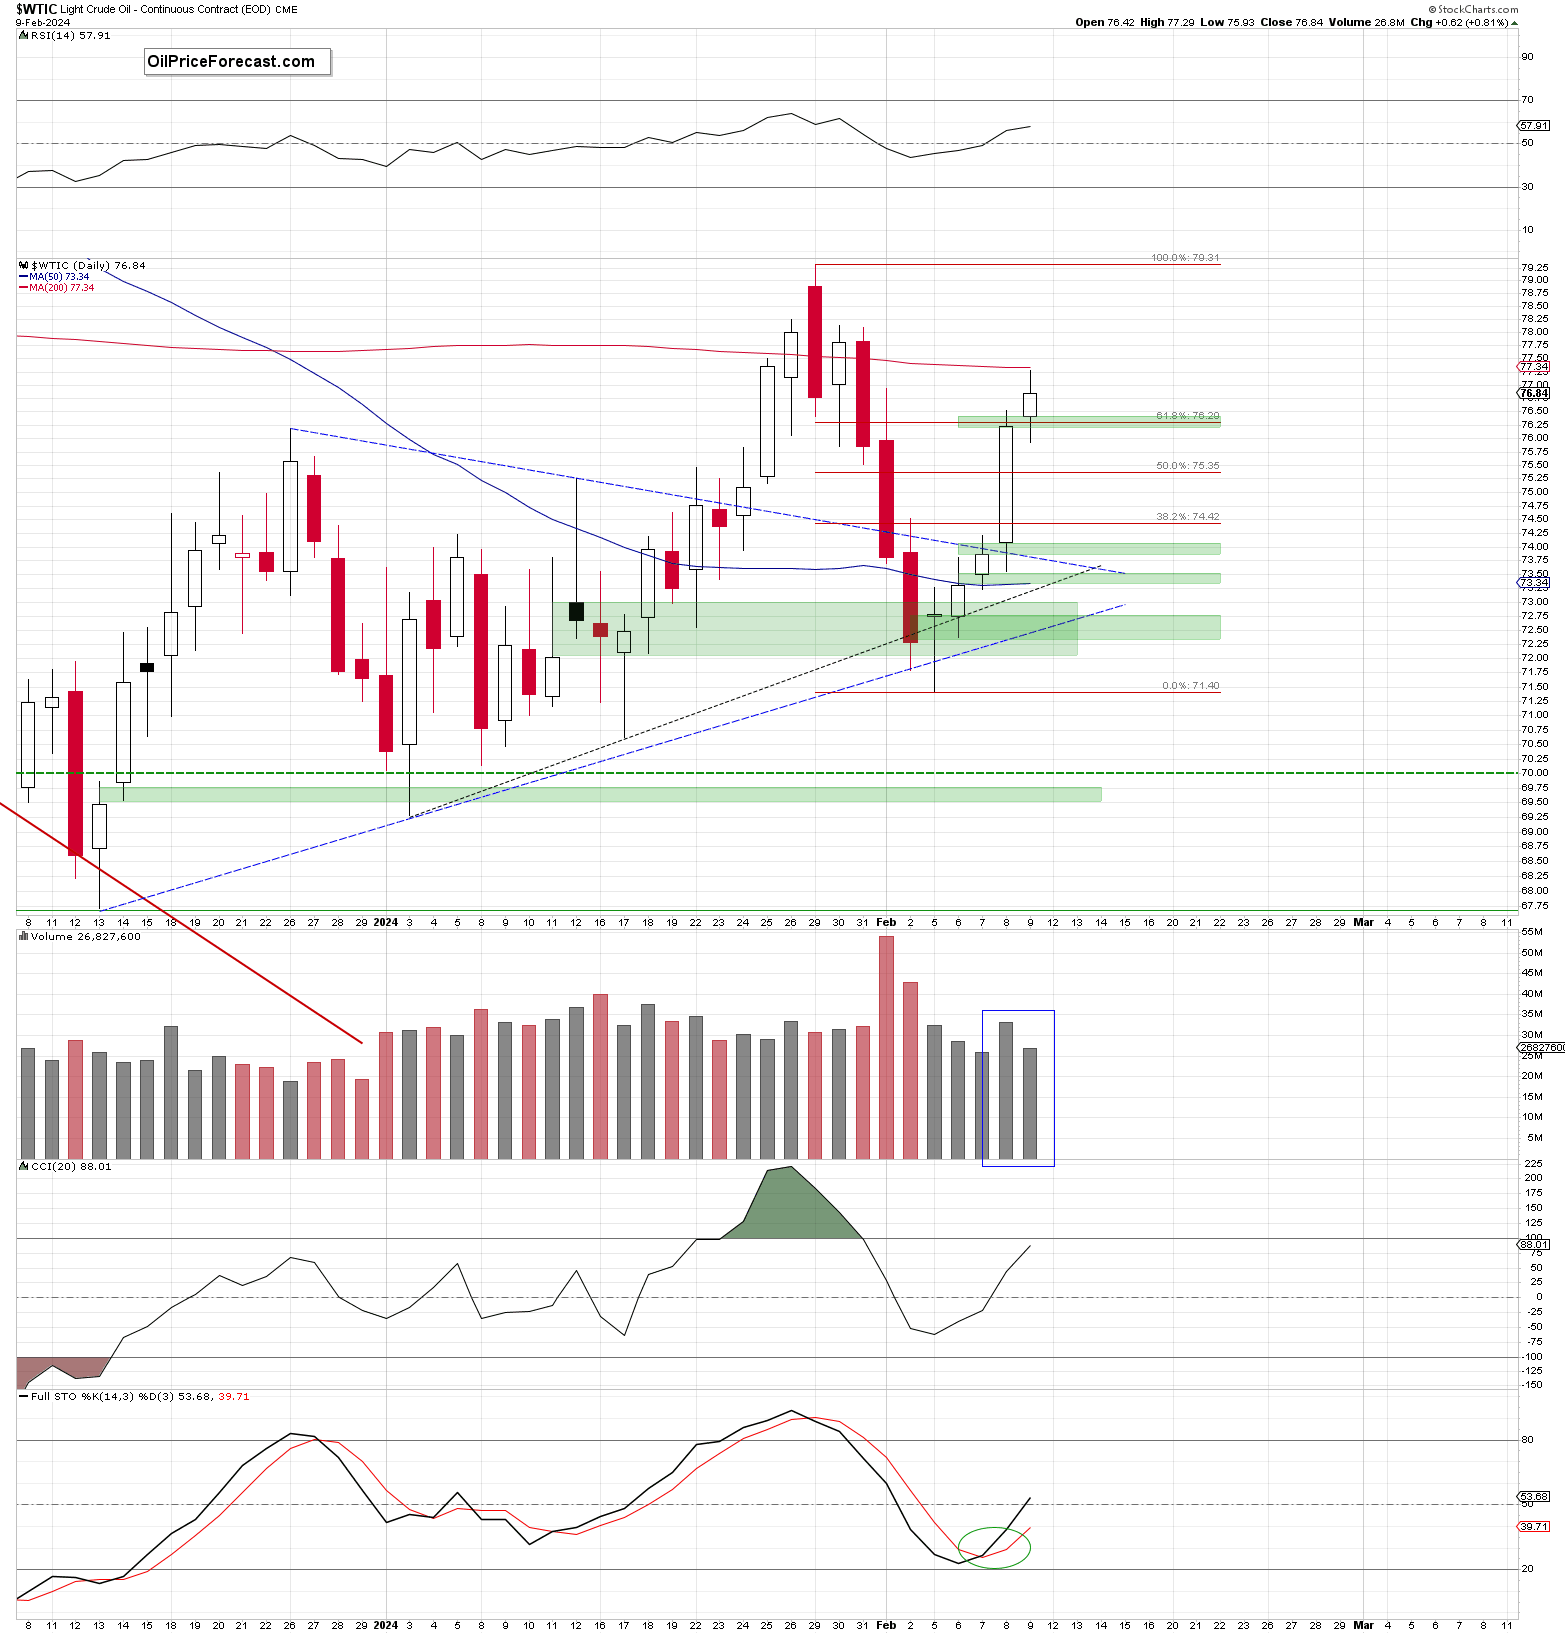
Looking at the daily chart from a closer perspective, we see that crude oil opened Friday’s session for a third time in a row with a green gap ($76.22-$76.42), which (just like a day earlier) encouraged the sellers to act.
Thanks to them, the price of black gold pulled back and tested the previously broken 61.8% Fibonacci retracement and the lower line of the gap. Although the seller moved even lower, these supports withstood the selling pressure and light crude reversed and rebounded, climbing above the opening price ang the gap – similarly to what we saw on Thursday.
This time, however, the upswing was much smaller, but the bulls managed to test the next resistance zone. As you see, they didn’t manage to hold gained levels and quite quickly, the price slipped lower, finishing the day under the 200-day moving average.
What’s next?
On one hand, another green gap looks encouraging – especially when we factor in the buy signal generated by the Stochastic Oscillator. However, on the other hand, smaller volume during recent increase raises some doubts about the bulls’ strength and their ability to break above the mentioned resistance zone.
These concerns are also strengthened by the proximity of the huge pro-declining candlestick formation and its negative implications.
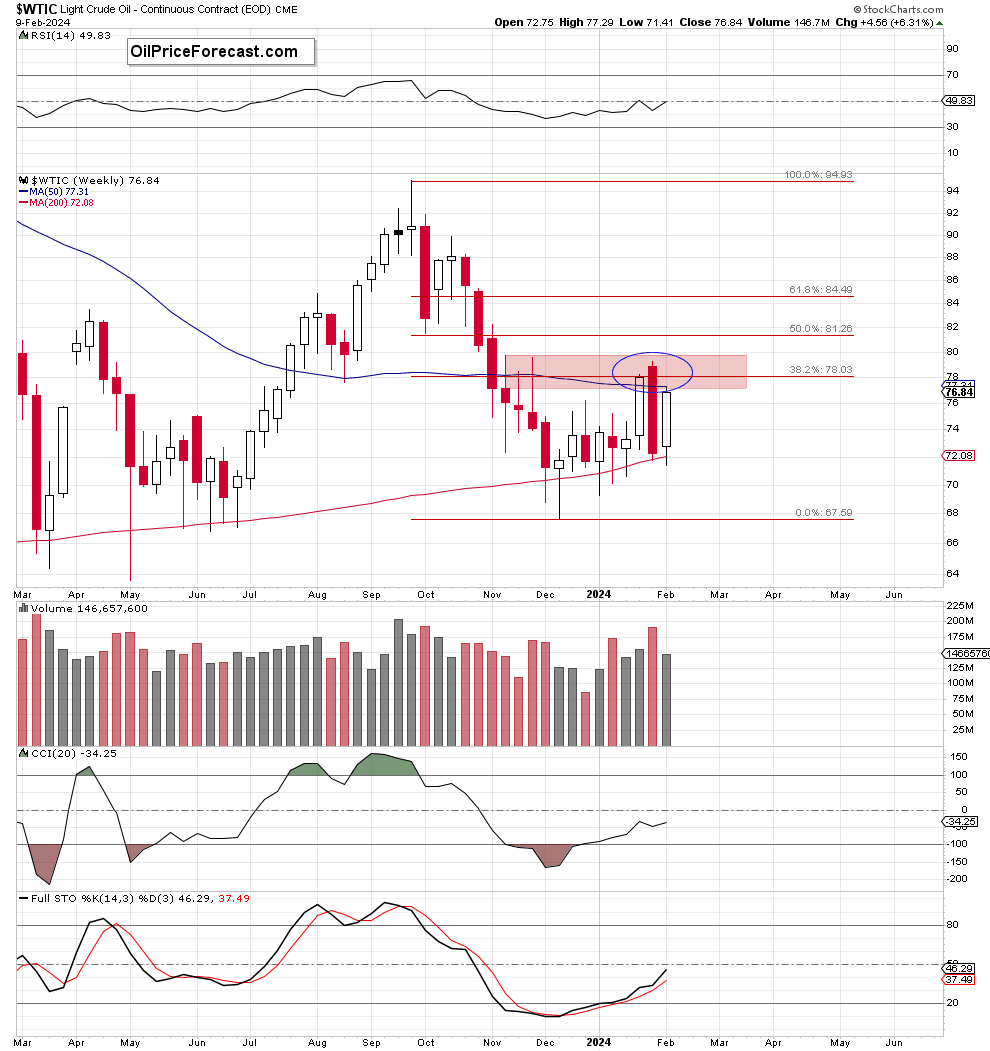
As a reminder, the bears attack at the beginning of the month took the price of black gold under the previous week’s opening price, which resulted in the creation of a big bearish engulfing candlestick formation, which together with the red resistance zone and the 38.2% Fibonacci retirement continues to block the way to higher levels.
Additionally, last week’s decline materialized on visibly smaller volume, suggesting that the bulls may be not as strong as it may seem (focusing only on the daily chart) and reversal may be just around the corner.
If this is the case and the bulls do not manage to climb higher, all the above-mentioned technical factors could lure the sellers to the trading floor and trigger a correction.
Therefore, careful observation of the behavior of market participants during the next session can provide very valuable clues about the next major price movement.
Reversal around the corner
Summing up, crude oil opened Friday’s session with another gap, which, triggered one more upswing that caused a test of the next resistance zone. Despite this improvement, there are first signs on the horizon that suggest that reversal may be just around the corner. Therefore, if there are further reliable signals confirming the exhaustion of buyers' power, opening short positions may be taken into account. Stay tuned.
If you don’t want to miss another profitable trading opportunity, I encourage you to subscribe to Oil Trading Alerts. In particular, I encourage you to subscribe now, because a free, 10-day trial is now available. Go premium today.
And if you’re not yet on our free mailing list, I strongly encourage you to join it - you’ll stay up to date with our free analyses that will still put you ahead of 99% of investors that don’t have access to this information. Join our free oil newsletter today.
See you tomorrow.
Want free follow-ups to the above article and details not available to 99%+ investors? Sign up to our free newsletter today!
Want free follow-ups to the above article and details not available to 99%+ investors? Sign up to our free newsletter today!
Author

Anna Radomska
Sunshine Profits
Anna's passion for drawing evolved into a fascination with colorful lines and shapes, which later inspired her interest in the stock market.


