|

Crude Oil Elliott Wave technical analysis [Video]

WTI Elliott wave analysis

WTI continues the minor recovery from September and may reach $80 in the coming days. However, if the rally is capped below $84.5 at the top of July 2024, the commodity will likely lose its bullish pace and then sell off.

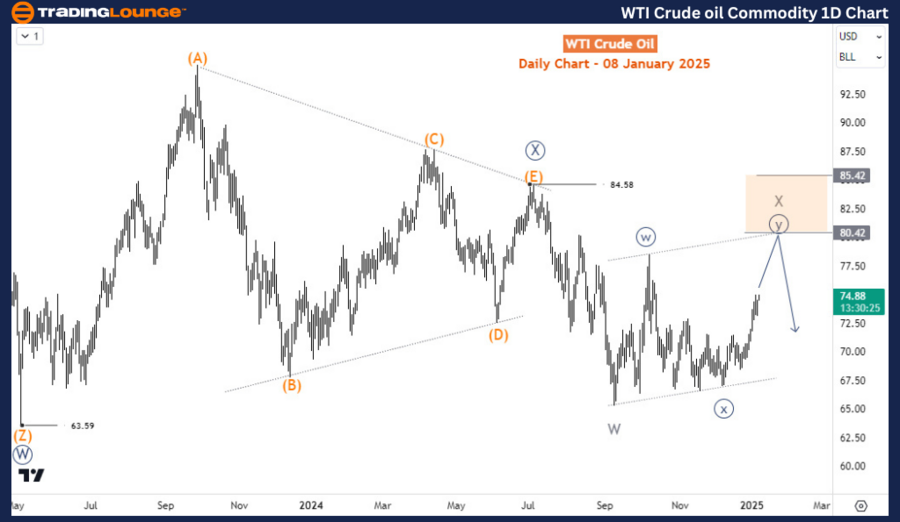
WTI daily chart analysis

The commodity is still within the corrective bearish sequence from March 2022 where it reached its peak of the last 16 years. On the daily chart, this corrective sequence is evolving as a double zigzag structure. Wave ((W)) finished in May 2023 followed by a choppy bounce in the form of a triangle structure for wave ((X)). Wave ((X)) ended at 84.58 in July 2024. Since that time, wave ((Y)) has emerged lower. Wave W of (W) of ((Y)) finished at 65.25 in September 2024. Afterward, wave X emerged as a double zigzag with ((w)) and ((x)) of Y ending in October 2024 and December 2024 respectively. The current surge from 67 is expected to extend higher toward $80 to finish wave X before the price starts turning lower again.

WTI

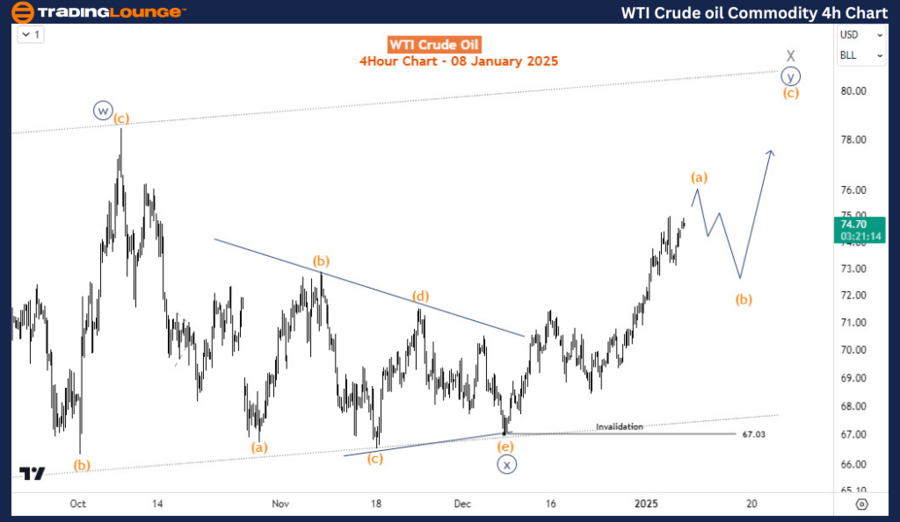
WTI four-hour chart analysis

Price is close to finishing wave (a) of ((y)) of X with an impulse structure. A pullback in wave (b) should emerge soon. However, the pullback in (b) should finish above 67 while the price emerges higher toward 80 to complete wave X.

oil

Crude Oil Elliott Wave technical analysis [Video]

Author

Peter Mathers

Peter Mathers

TradingLounge

Peter Mathers started actively trading in 1982. He began his career at Hoei and Shoin, a Japanese futures trading company.

More from Peter Mathers
Share:

Editor's Picks

EUR/USD hits two-day highs near 1.1820

EUR/USD picks up pace and reaches two-day tops around 1.1820 at the end of the week. The pair’s move higher comes on the back of renewed weakness in the US Dollar amid growing talk that the Fed could deliver an interest rate cut as early as March. On the docket, the flash US Consumer Sentiment improves to 57.3 in February.

GBP/USD reclaims 1.3600 and above

GBP/USD reverses two straight days of losses, surpassing the key 1.3600 yardstick on Friday. Cable’s rebound comes as the Greenback slips away from two-week highs in response to some profit-taking mood and speculation of Fed rate cuts. In addition, hawkish comments from the BoE’s Pill are also collaborating with the quid’s improvement.

Gold climbs further, focus is back to 45,000

Gold regains upside traction and surpasses the $4,900 mark per troy ounce at the end of the week, shifting its attention to the critical $5,000 region. The move reflects a shift in risk sentiment, driving flows back towards traditional safe haven assets and supporting the yellow metal.

Crypto Today: Bitcoin, Ethereum, XRP rebound amid risk-off, $2.6 billion liquidation wave

Bitcoin edges up above $65,000 at the time of writing on Friday, as dust from the recent macro-triggered sell-off settles. The leading altcoin, Ethereum, hovers above $1,900, but resistance at $2,000 caps the upside. Meanwhile, Ripple has recorded the largest intraday jump among the three assets, up over 10% to $1.35.

Three scenarios for Japanese Yen ahead of snap election

The latest polls point to a dominant win for the ruling bloc at the upcoming Japanese snap election. The larger Sanae Takaichi’s mandate, the more investors fear faster implementation of tax cuts and spending plans. 

XRP rally extends as modest ETF inflows support recovery

Ripple is accelerating its recovery, trading above $1.36 at the time of writing on Friday, as investors adjust their positions following a turbulent week in the broader crypto market. The remittance token is up over 21% from its intraday low of $1.12.