|

Crude Oil Elliott Wave technical analysis [Video]

WTI Oil Elliott Wave analysis

WTI is still under pressure after being resisted returning to the 80s in October. Thus, the commodity has recorded a net loss in the last four weeks, adding to the sell-off from March 2022, when it was traded for close to $131. From a technical standpoint, the downside risk is still strong, and traders may see the commodity plummet to $60 in the coming weeks or days.

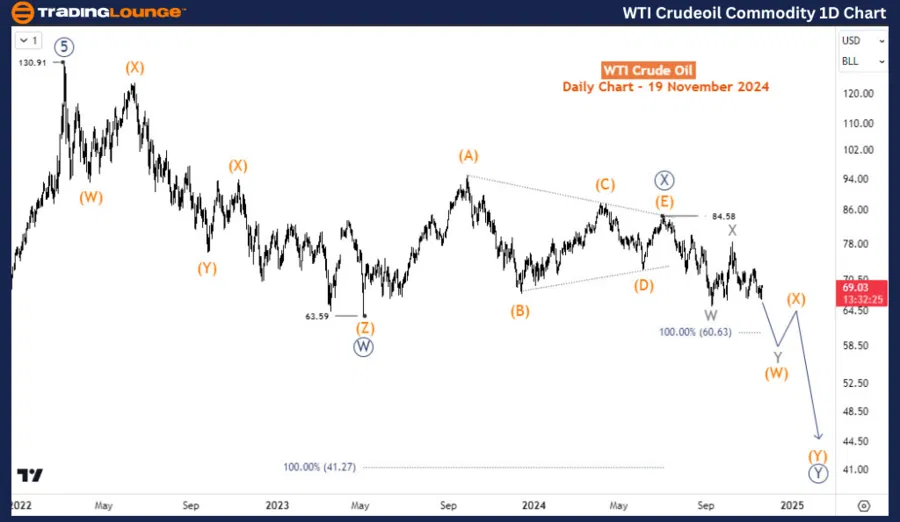
On the daily chart, the sell-off from $130.91 is corrective and unfolding into a double zigzag structure. from the big picture, the commodity is correcting the impulse rally starting from the Covid low in April 2020 to March 2022 when it reached a $130.91 peak.

Wave ((W)) finished at 63.5 in May 2023 then followed by a triangle structure for wave ((X)) which finished at 85.5 in July 2024. From July, wave ((Y)) has evolved. Based on the previous and current price action, we will anticipate a double or triple zigzag structure for wave ((Y)) which could extend to $41 in the coming months. However, $60.6 is the next target where we expect wave (W) of ((Y)) to finish before another bounce for (X).

Oil

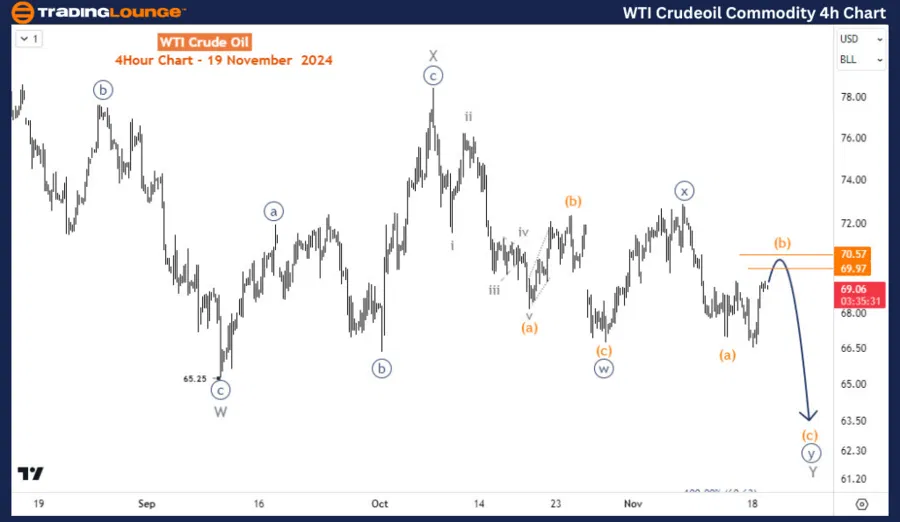
On the H4 chart price is unfolding as a flat structure for wave (b) of ((y)) of Y. While the current bounce is capped below the November highs, further decline could ensue toward $60.6 in the short term.

OIL

Crude Oil Elliott Wave technical analysis [Video]

Author

Peter Mathers

Peter Mathers

TradingLounge

Peter Mathers started actively trading in 1982. He began his career at Hoei and Shoin, a Japanese futures trading company.

More from Peter Mathers
Share:

Editor's Picks

EUR/USD hits two-day highs near 1.1820

EUR/USD picks up pace and reaches two-day tops around 1.1820 at the end of the week. The pair’s move higher comes on the back of renewed weakness in the US Dollar amid growing talk that the Fed could deliver an interest rate cut as early as March. On the docket, the flash US Consumer Sentiment improves to 57.3 in February.

GBP/USD reclaims 1.3600 and above

GBP/USD reverses two straight days of losses, surpassing the key 1.3600 yardstick on Friday. Cable’s rebound comes as the Greenback slips away from two-week highs in response to some profit-taking mood and speculation of Fed rate cuts. In addition, hawkish comments from the BoE’s Pill are also collaborating with the quid’s improvement.

Gold climbs further, focus is back to 45,000

Gold regains upside traction and surpasses the $4,900 mark per troy ounce at the end of the week, shifting its attention to the critical $5,000 region. The move reflects a shift in risk sentiment, driving flows back towards traditional safe haven assets and supporting the yellow metal.

Crypto Today: Bitcoin, Ethereum, XRP rebound amid risk-off, $2.6 billion liquidation wave

Bitcoin edges up above $65,000 at the time of writing on Friday, as dust from the recent macro-triggered sell-off settles. The leading altcoin, Ethereum, hovers above $1,900, but resistance at $2,000 caps the upside. Meanwhile, Ripple has recorded the largest intraday jump among the three assets, up over 10% to $1.35.

Three scenarios for Japanese Yen ahead of snap election

The latest polls point to a dominant win for the ruling bloc at the upcoming Japanese snap election. The larger Sanae Takaichi’s mandate, the more investors fear faster implementation of tax cuts and spending plans. 

XRP rally extends as modest ETF inflows support recovery

Ripple is accelerating its recovery, trading above $1.36 at the time of writing on Friday, as investors adjust their positions following a turbulent week in the broader crypto market. The remittance token is up over 21% from its intraday low of $1.12.