Crude Oil Elliott Wave technical analysis [Video]
![Crude Oil Elliott Wave technical analysis [Video]](https://editorial.fxstreet.com/images/Markets/Commodities/Energy/Oil/hand-full-of-oil-14004600_XtraLarge.jpg)
WTI Elliott Wave analysis
WTI Crude Oil is breaking out of a 15-month period of sideways, choppy price action and appears poised to make a new low, potentially reaching levels unseen since late 2021. This breakout is part of a broader long-term bearish phase that began in March 2022, when WTI peaked near $131. As the bearish trend resumes, the question arises: how low can this leg of the decline reach?
Long-term chart analysis
In the long-term view, WTI entered a bearish corrective phase in May 2022 after reaching $130.91. This corrective phase follows a powerful bullish impulse that began after the COVID-19 crash, which saw oil prices recover sharply to their highest levels since the 2008 global financial crisis. The ongoing bearish correction is unfolding in the form of a double zigzag pattern, a complex Elliott Wave structure commonly seen in extended corrections.
The first leg of this correction, wave W (circled), ended in March 2023 when WTI hit $64.56. Since then, the price action has moved sideways, indicating indecision in the market. However, this period of stagnation culminated in August 2024, when the sideways movement formed a triangle pattern, marking the completion of wave X (circled). The recent breakout from this triangle suggests that the next phase of selling pressure has begun, which could last for several months as the market moves toward the next key support levels.
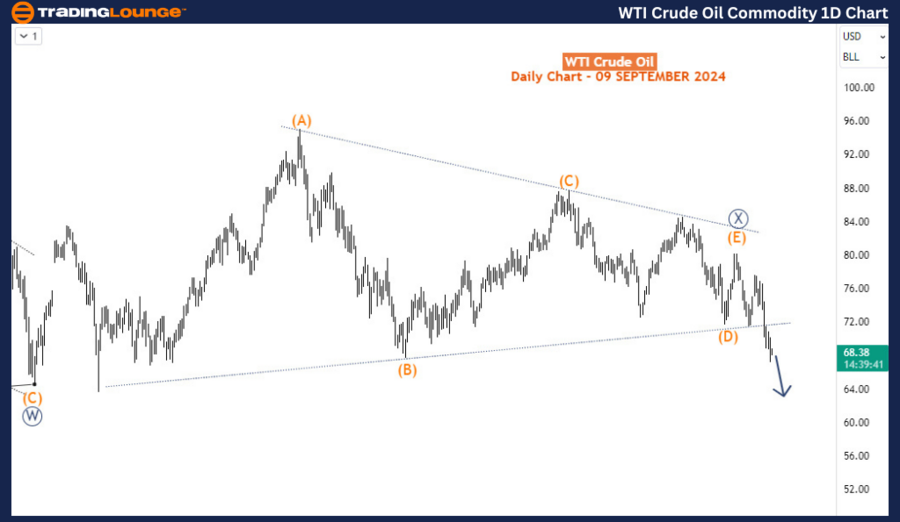
Daily chart analysis
On the daily chart, the triangle that formed as part of wave X (circled) was a consolidation pattern, and the breakout confirms the beginning of wave Y (circled), the final leg of the double zigzag correction. The downward momentum is likely to accelerate as wave Y progresses. Traders and analysts will closely monitor the smaller waves that compose wave Y (circled) as they unfold over the coming weeks and months. Given the scale of the correction, WTI could potentially revisit lows around or below $50 as the bearish phase plays out.
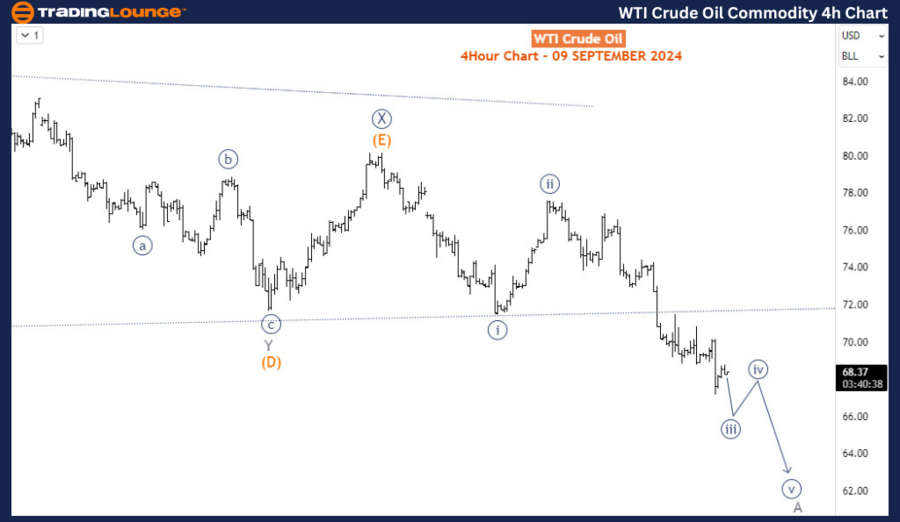
Four-hour chart analysis
The H4 chart provides further insight into the early stages of this new bearish wave. The breakout structure appears to be an impulsive decline for wave A of (A)/(W) of Y (circled), signaling the start of a new downward leg. After the completion of wave A, the market is likely to experience a corrective bounce for wave B before resuming its decline. This presents an opportunity for short-term and medium-term traders to sell into the bounces, as the broader bearish trend remains intact. The strategy of selling corrective rallies could be particularly effective during this phase, given the strong downward momentum anticipated for wave Y (circled).
In summary, WTI’s breakout from the 15-month consolidation marks the beginning of a renewed bearish phase, likely targeting new lows. The Elliott Wave structure supports further declines, with traders advised to watch for selling opportunities during corrective bounces, as WTI could continue its slide toward levels not seen since 2021.
Crude Oil Elliott Wave technical analysis [Video]
Author

Peter Mathers
TradingLounge
Peter Mathers started actively trading in 1982. He began his career at Hoei and Shoin, a Japanese futures trading company.


