WTI Elliott Wave analysis

WTI Crude Oil is breaking out of a range that has persisted for over a year, signaling potential further declines in the coming weeks. After a swift recovery between August 5th and 13th, the commodity quickly erased those gains within a single week. Despite currently trading above the $70 level, bearish momentum suggests a move into the $60 range may be imminent.

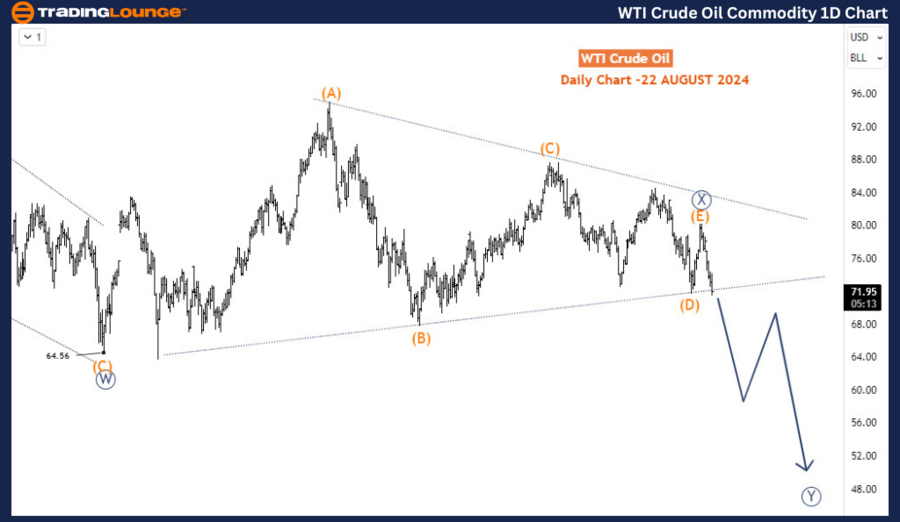
Daily chart analysis

On the daily chart, WTI Crude remains in a corrective phase, retracing the significant bullish move seen between April 2020 and March 2022. This correction is unfolding in the form of a complex double zigzag pattern, identified as waves W-X-Y of the primary degree. The initial leg of the correction, wave W (circled), concluded in March 2023, displaying a classic zigzag structure. This was followed by a sideways consolidation, characterized by a triangle pattern, forming wave X (circled) of the primary degree.

With the recent breakdown below the triangle boundary, the market appears to be initiating wave A of (W) within the final leg of the Y wave (circled). This suggests that the bearish trend is gaining strength, and further declines are likely as the market moves deeper into this corrective phase.

Oil

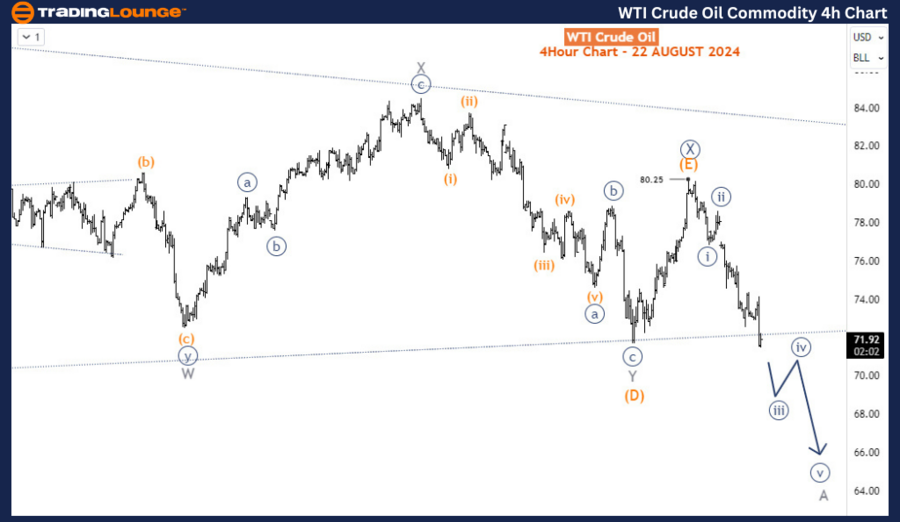
Four-hour chart analysis

Zooming into the 4-hour chart, the current downtrend is unfolding as an impulse wave, particularly in the third wave of the sequence, labeled as wave iii (circled) of A. This suggests that the decline is not yet complete, and prices are likely to drop below $70 before wave A finalizes. Once this leg concludes, a corrective wave B bounce is anticipated, which should be capped below the resistance at $80.25. This will set the stage for a final decline in wave C, completing the current bearish cycle.

WTI

Overall, WTI Crude remains aligned with the broader downtrend that began in March 2022, with the technical structure supporting a bearish outlook. As the market completes the corrective double zigzag pattern, lower prices remain the primary expectation in the medium term, especially if wave iii (circled) continues its trajectory. Traders should remain cautious of potential bearish setups, as any corrective bounces are likely to be short-lived and capped by key resistance levels.

Crude Oil Elliott Wave technical analysis [Video]

As with any investment opportunity there is a risk of making losses on investments that Trading Lounge expresses opinions on.

Historical results are no guarantee of future returns. Some investments are inherently riskier than others. At worst, you could lose your entire investment. TradingLounge™ uses a range of technical analysis tools, software and basic fundamental analysis as well as economic forecasts aimed at minimizing the potential for loss.

The advice we provide through our TradingLounge™ websites and our TradingLounge™ Membership has been prepared without considering your objectives, financial situation or needs. Reliance on such advice, information or data is at your own risk. The decision to trade and the method of trading is for you alone to decide. This information is of a general nature only, so you should, before acting upon any of the information or advice provided by us, consider the appropriateness of the advice considering your own objectives, financial situation or needs. Therefore, you should consult your financial advisor or accountant to determine whether trading in securities and derivatives products is appropriate for you considering your financial circumstances.

Recommended Content


Recommended Content

Editors’ Picks

EUR/USD stays below 1.1150 ahead of US PMI data

EUR/USD stays below 1.1150 ahead of US PMI data

EUR/USD struggles to gain traction and trades below 1.1150 in the American session on Thursday. The US Dollar holds its ground as market mood remains cautious ahead of US PMI data, forcing the pair to stay on the back foot.

EUR/USD News

GBP/USD retreats to 1.3100, eyes on US data

GBP/USD retreats to 1.3100, eyes on US data

GBP/USD pulls away from the 13-month high it set at 1.3130 on upbeat UK PMI data earlier in the day and trades near 1.3100. Investors await preliminary S&P Global Services and Manufacturing PMI data from the US.

GBP/USD News

Gold test $2,500 as US T-bond yields rebound

Gold test $2,500 as US T-bond yields rebound

Gold stays under modest bearish pressure and trades near $2,500 in the second half of the day on Thursday. The benchmark 10-year US Treasury bond yield is up more than 1% on the day ahead of US PMI data, making it hard for XAU/USD to hold its ground.

Gold News

MATIC price poised for rally as on-chain data shows a positive bias

MATIC price poised for rally as on-chain data shows a positive bias

Polygon's (MATIC) price has risen 27% since the start of this week and, as of Thursday, is continuing to trade higher by 0.5% at $0.52. On-chain data shows that MATIC's TVL is rising.

Read more

US S&P Global PMIs seen broadly unchanged in August, signaling moderate economic expansion

US S&P Global PMIs seen broadly unchanged in August, signaling moderate economic expansion

S&P Global will publish the preliminary estimates of the US PMIs for August on Thursday. The indexes are the result of surveys of the senior executives in the private sector and are meant to indicate the overall health of an economy.

Read more

Moneta Markets review 2024: All you need to know

Moneta Markets review 2024: All you need to know

VERIFIED In this review, the FXStreet team provides an independent and thorough analysis based on direct testing and real experiences with Moneta Markets – an excellent broker for novice to intermediate forex traders who want to broaden their knowledge base.

Read More

Majors

Cryptocurrencies

Signatures