Crude Oil Elliott Wave technical analysis [Video]
![Crude Oil Elliott Wave technical analysis [Video]](https://editorial.fxstreet.com/images/Markets/Commodities/Energy/Oil/hand-full-of-oil-14004600_XtraLarge.jpg)
WTI Elliott Wave analysis
WTI Crude is showing gains in August 2024 after a sell-off in July, yet the commodity seems to have been trading within a range since March 2023. The current rally may face resistance below $85 before sellers potentially step in again.
Long-term outlook
In the long term, WTI Crude is in a corrective phase, retracing the bullish impulse that spanned from April 2020 to March 2022. This corrective phase appears to be forming a double zigzag pattern, identified as waves W-X-Y of the primary degree. Wave W (circled) concluded in March 2023 with a zigzag structure, and since then, the price has moved sideways, with no clear breakout direction. From an Elliott Wave perspective, this sideways movement is forming a triangle pattern for wave X (circled).
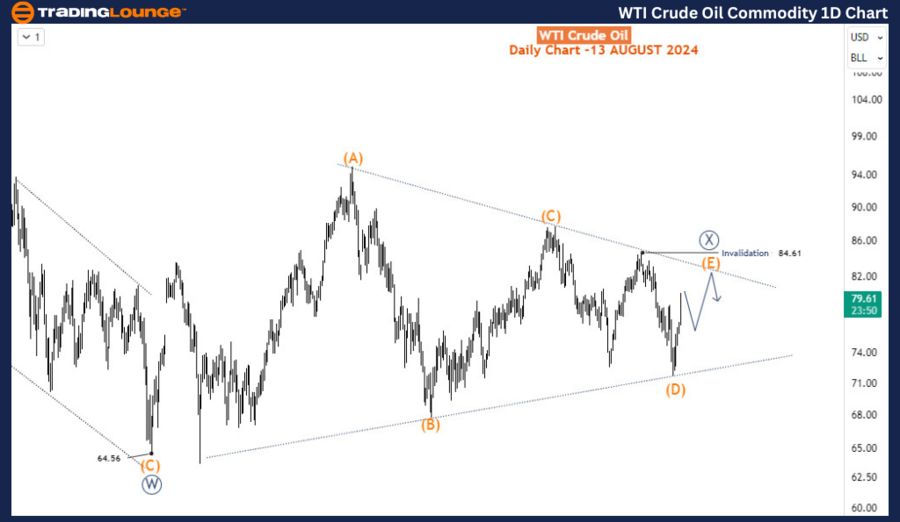
Daily chart analysis
On the daily chart, WTI has completed waves A, (B), (C), and (D) of wave X (circled). The ongoing rally from the August 2024 low is likely part of wave (E), which should complete wave X (circled). Wave (E) is expected to finish as a corrective structure, most likely forming a zigzag pattern.
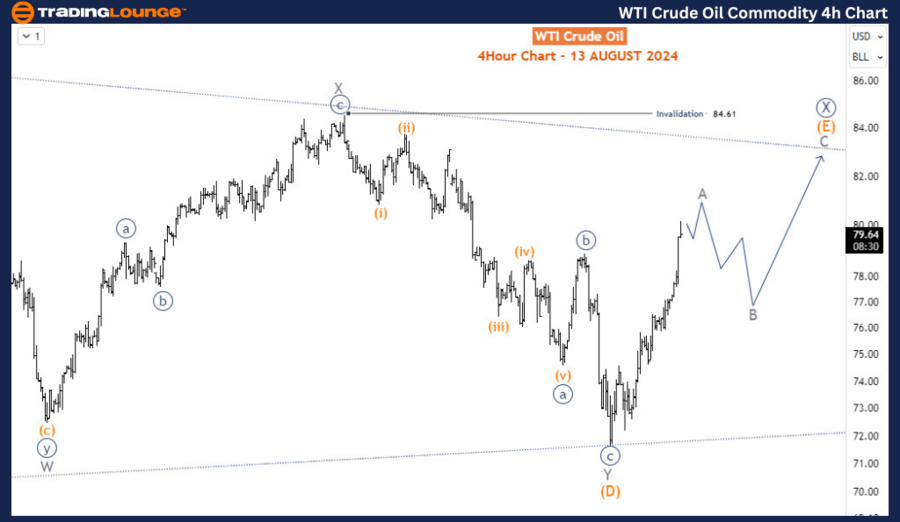
Four-hour chart analysis
The H4 chart shows that the current rally is clearly an impulse wave, labeled as wave A of (E). After wave A completes, a pullback for wave B is expected, followed by further rallies to complete wave C of (E). As long as the 84.6 invalidation level is not breached, the long-term outlook remains bearish. However, the current rally is likely to continue in the short term.
Conclusion
WTI Crude is currently experiencing a short-term rally that may face resistance below $85. While the broader outlook remains bearish, this rally is expected to complete wave (E) of X (circled) before the market resumes its downward trend. Traders should watch for a pullback after wave A completes, as this could offer opportunities for short-term gains before the larger downtrend continues.
Crude Oil Elliott Wave technical analysis [Video]
Author

Peter Mathers
TradingLounge
Peter Mathers started actively trading in 1982. He began his career at Hoei and Shoin, a Japanese futures trading company.


