Crude Oil Elliott Wave technical analysis [Video]
![Crude Oil Elliott Wave technical analysis [Video]](https://editorial.fxstreet.com/images/Markets/Commodities/Energy/Oil/three-orange-oil-pumps-against-cloudy-sky-16955370_XtraLarge.jpg)
WTI Elliott Wave analysis
Function - Counter-trend for wave 2.
Mode - Corrective.
Structure - Impulse for wave a of 2.
Position - Wave 3.
Direction - Wave 3 is in play.
Details - We still count lower for wave 3 after the commodity broke below 80.29. It still favors the downside toward 75-76 at least.
The recent movements in the WTI Crude Oil market suggest a continuation of the bearish trend that began in April 2024. The commodity is gradually unwinding the gains from June 2024, with a decline of about 60%. This movement is indicative of a reversal rather than a correction, suggesting that WTI will likely continue its downward trajectory. Additionally, the long-term outlook remains bearish, with the decline from March 2022 being corrective and expected to continue below the March 2023 low into the $50 range. The current decline from early July 2024 aligns with this long-term bearish perspective, provided the resistance at 87.63 remains intact.
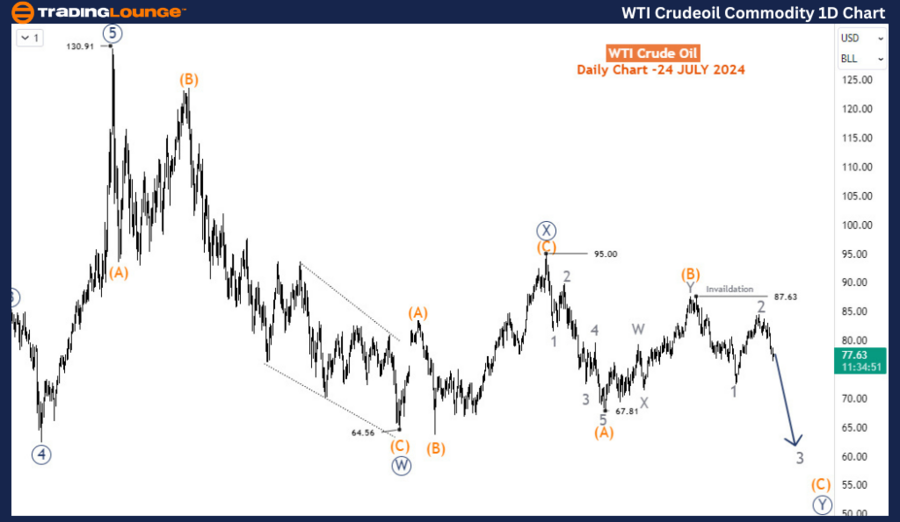
Daily chart analysis
On the daily chart, the corrective structure from March 2022 is visible, when WTI topped at nearly $131. The first leg of the corrective cycle ended at $64.5 in March 2023, marking wave W (circled) of the primary degree. This was followed by a corrective surge for wave X (circled), which ended at $95 in September 2023. The third leg of the bearish cycle, wave Y (circled), then began. Within wave Y, waves (A) and (B) concluded at 67.81 in December 2023 and 87.63 in April 2024, respectively. Wave (C) initiated from 87.63 and is anticipated to decline in a 5-wave structure. Waves 1 and 2 of (C) appear to have been completed, with the current decline marking wave 3 of (C). Projections indicate that wave 3 could reach $61 or lower before experiencing a significant bounce.
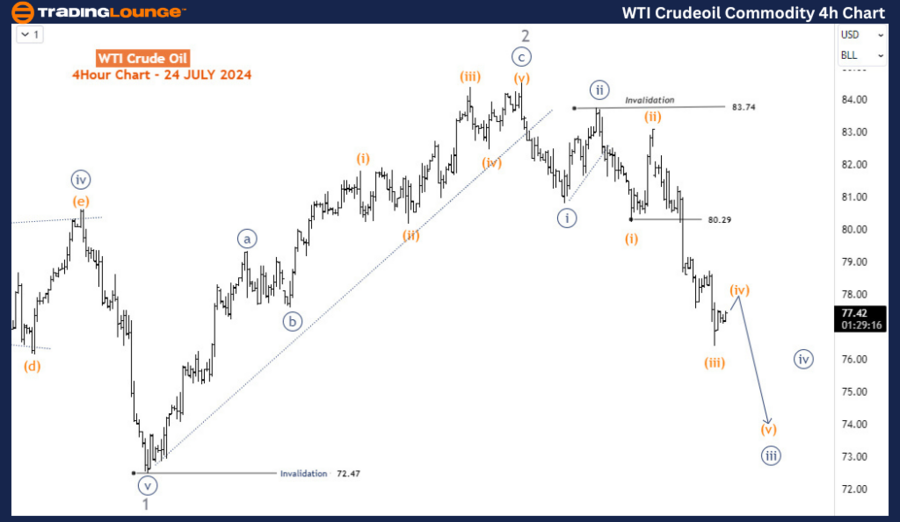
Four-hour chart analysis
On the H4 chart, the focus is on the sub-waves of wave 3. The price is currently in its third wave, wave iii (circled) of 3. This suggests that wave 3 still has substantial room to move downward. Consequently, the current scenario favors sellers, who may look for opportunities during corrective bounces.
Summary
In summary, the Elliott Wave analysis for WTI Crude Oil indicates a continuation of the bearish trend. Key levels to watch include the support at $61 and the resistance at 87.63. The long-term and short-term analyses both suggest further declines, with wave 3 of (C) projected to hit $61 or lower. Traders should be cautious and look for selling opportunities during corrective bounces. By monitoring wave structures and key price levels, traders can effectively anticipate future movements in the WTI Crude Oil market and make informed decisions.
Crude Oil Elliott Wave technical analysis [Video]
Author

Peter Mathers
TradingLounge
Peter Mathers started actively trading in 1982. He began his career at Hoei and Shoin, a Japanese futures trading company.


