WTI Elliott Wave technical analysis

Function - Counter-trend for wave 2.

Mode - Corrective.

Structure - Impulse for wave a of 2.

Position - Wave 2.

Direction - Wave 3.

Details - With the extended rally from 72.47, we count higher for wave 2. The structure from 72.7 is tricky so we should wait for a 5-swing down below 80 to confirm the start of wave 3.

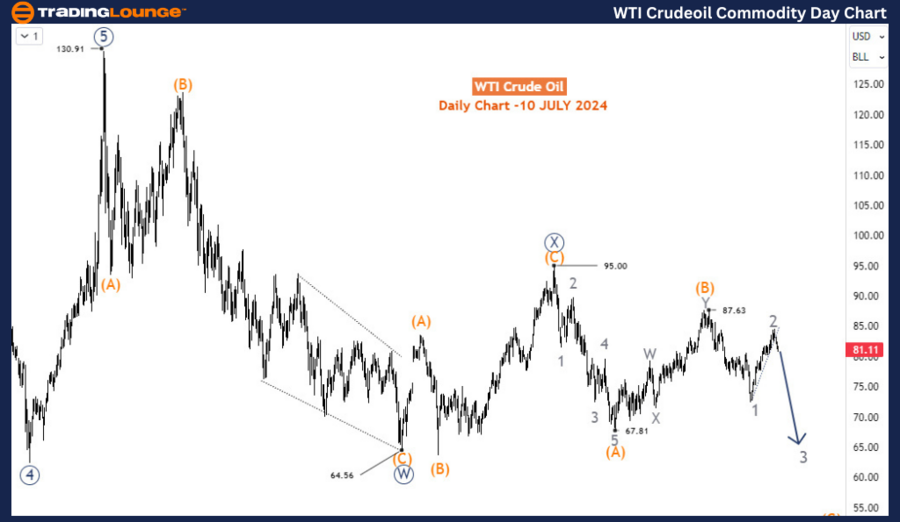
WTI crude oil is retreating after a month-long rally from June 4th to July 5th, 2024. This downside break suggests that the larger decline, which started in April 2024, has the potential to continue below the June 4th low. If the decline is not that deep, it should at least retrace 50% of the immediate rally to the April 5th low.

Long-term analysis

In the long term, WTI is undergoing a bearish correction. This correction is a response to the impulse rallies from the COVID-19 lows to the highs during the Russia/Ukraine conflict at $130.91. The bearish correction began at $130.91 in March 2022. The daily chart reveals that the long-term bearish corrective cycle is developing into a double zigzag structure. Wave W (circled) concluded at $64.56 in March 2024, followed by wave X (circled), which finished at $95 in September 2023. Wave Y (circled) then began, potentially forming a double zigzag subdivided into waves (A)-(B)-(C). Waves (A) and (B) ended at $67.8 and $87.6 in December 2023 and April 2024, respectively. The commodity is now anticipated to decline in wave (C), which could develop into either an impulse or a diagonal 5-wave structure. It appears that waves 1 and 2 of (C) have been completed, setting the stage for a decline in wave 3.

Chart

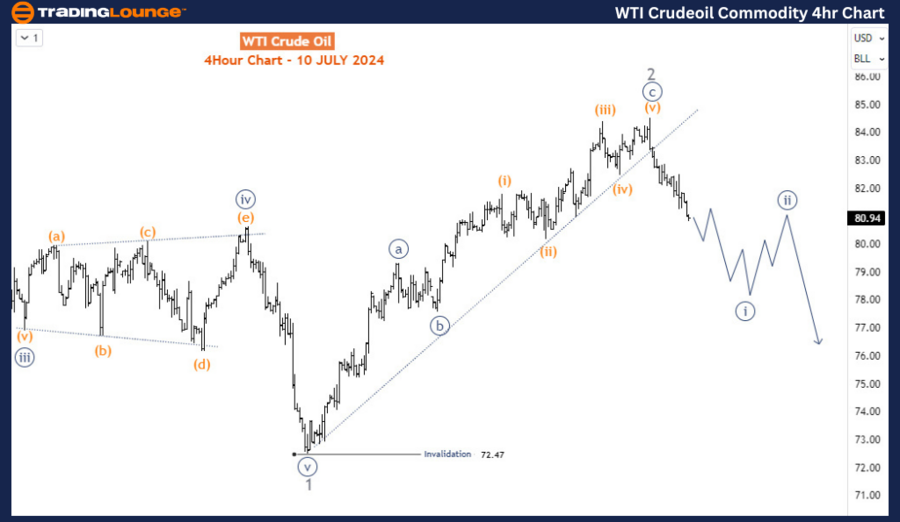
Four-hour chart analysis

On the H4 chart, wave 2 appears to have ended with a zigzag structure, followed by a downside break for wave 3. A break below $80 with an impulse wave would confirm the start of wave 3. While the downside forecast for wave 3 is not yet solidified, there is a significant chance of a continuous decline toward and below $72.47 if the price stays below the current wave 2 high of $84.5.

WTI

Conclusion

Both the long-term and H4 charts indicate that WTI crude oil is amid a bearish correction with the potential for further declines. The double zigzag structure on the daily chart and the zigzag completion on the H4 chart suggest that the price is likely to continue its downward trajectory. By closely monitoring the development of wave (C) on the daily chart and wave 3 on the H4 chart, traders can identify strategic entry points to capitalize on the anticipated decline. If the price remains below $84.5, a substantial move toward $72.47 or lower is highly probable, providing ample opportunities for bearish positions.

Crude Oil Elliott Wave technical analysis [Video]

As with any investment opportunity there is a risk of making losses on investments that Trading Lounge expresses opinions on.

Historical results are no guarantee of future returns. Some investments are inherently riskier than others. At worst, you could lose your entire investment. TradingLounge™ uses a range of technical analysis tools, software and basic fundamental analysis as well as economic forecasts aimed at minimizing the potential for loss.

The advice we provide through our TradingLounge™ websites and our TradingLounge™ Membership has been prepared without considering your objectives, financial situation or needs. Reliance on such advice, information or data is at your own risk. The decision to trade and the method of trading is for you alone to decide. This information is of a general nature only, so you should, before acting upon any of the information or advice provided by us, consider the appropriateness of the advice considering your own objectives, financial situation or needs. Therefore, you should consult your financial advisor or accountant to determine whether trading in securities and derivatives products is appropriate for you considering your financial circumstances.

Recommended Content


Recommended Content

Editors’ Picks

EUR/USD plummets to weekly lows near 1.0420

EUR/USD plummets to weekly lows near 1.0420

The strong, tariff-driven rebound in the US Dollar is now pushing EUR/USD to accelerate its daily losses toward the weekly lows around 1.0420–1.0415 on Thursday, ahead of upcoming speeches from Federal Reserve officials.

EUR/USD News
GBP/USD drops to two-day lows around 1.2630 on stronger Dollar

GBP/USD drops to two-day lows around 1.2630 on stronger Dollar

In line with its risk-releated peers, GBP/USD now succumbs to the bout of buying pressure in the Greenback, receding to two-day lows in the 1.2630 zone on Thursday ahead of comments from Fed policymakers and President Trump.

GBP/USD News
Gold flirts with two-week lows around $2,880

Gold flirts with two-week lows around $2,880

Gold prices resume their downtrend and revisit two-week lows in the sub-$2,880 zone per ounce troy following the improved tone in the US Dollar, higher yields and further tariff narrative.

Gold News
Bitcoin recovers above $85,000 while institutional investors offload their holdings

Bitcoin recovers above $85,000 while institutional investors offload their holdings

Bitcoin (BTC) recovers slightly and trades around $86,000 at the time of writing on Thursday after falling nearly 15% at one point this week. US President Donald Trump’s ongoing tariff news and falling institutional demand fueled the BTC’s correction. 

Read more
February inflation: Sharp drop expected in France, stability in the rest of the Eurozone

February inflation: Sharp drop expected in France, stability in the rest of the Eurozone

Inflation has probably eased in February, particularly in France due to the marked cut in the regulated electricity price. However, this overall movement masks divergent trends. Although disinflation is becoming more widespread, prices continue to rise rapidly in services, in France as well as elsewhere in the Eurozone.

Read more
The Best brokers to trade EUR/USD

The Best brokers to trade EUR/USD

SPONSORED Discover the top brokers for trading EUR/USD in 2025. Our list features brokers with competitive spreads, fast execution, and powerful platforms. Whether you're a beginner or an expert, find the right partner to navigate the dynamic Forex market.

Read More

Majors

Cryptocurrencies

Signatures

Best Brokers of 2025