Crude Oil Elliott Wave technical analysis [Video]
![Crude Oil Elliott Wave technical analysis [Video]](https://editorial.fxstreet.com/images/Markets/Commodities/Energy/Oil/prairie-pumpjack-silhouette-19527274_XtraLarge.jpg)
WTI Elliott wave analysis
Function - Counter-trend
Mode - Corrective
Structure - Triple Zigzag
Position - Wave X of triple zigzag
Direction - Wave Y of the triple zigzag
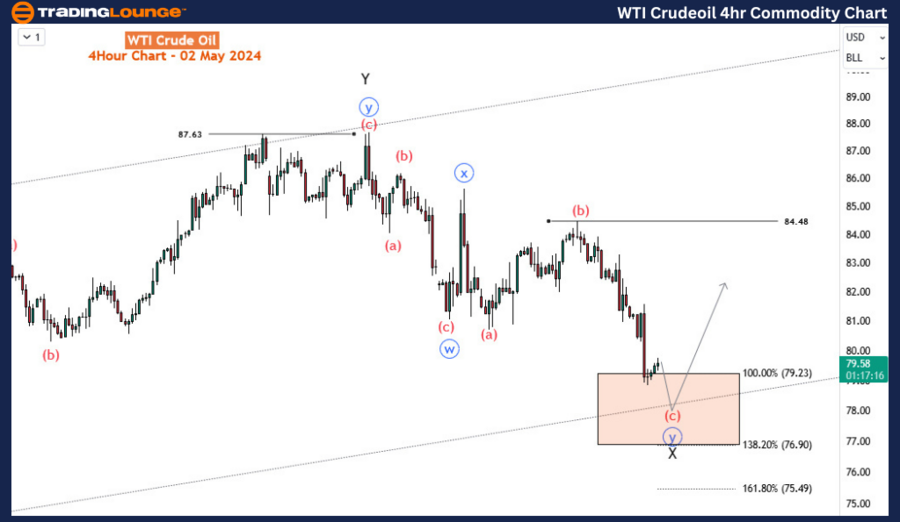
Details -Double zigzag for wave X entered the Fibonacci support base to find support after marginally surpassing the 80 major level. It may go deeper in the zone but should not exceed the invalidation level 75.49. A reaction upwards is expected from the zone.
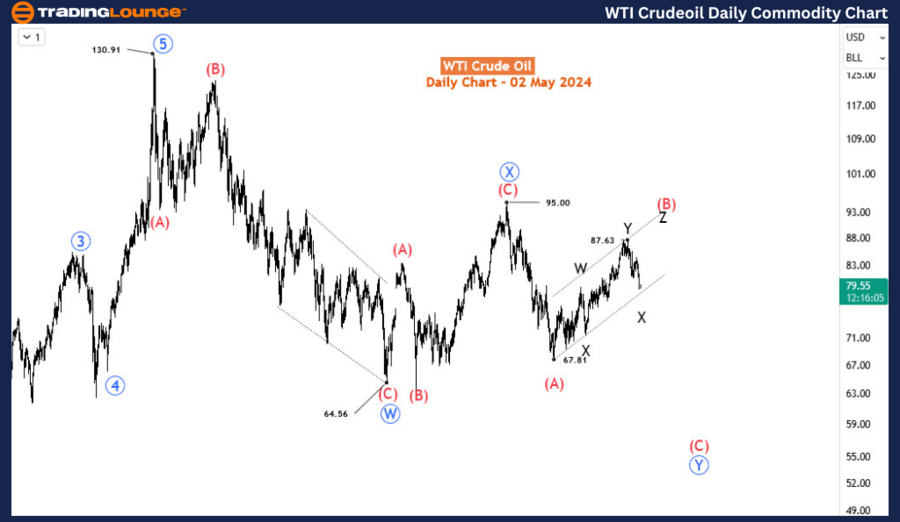
The US Crude Oil has been shedding prices since April 12, 2024. Since then, the commodity has lost nearly 10% in value. The fall followed a 4-month, 29% rally that started in December 2023. The question is whether the commodity will resume the recovery from December or if all of it will be lost in the coming weeks/months.
The daily chart captures the bearish cycle that retraces the strong impulse rally between the Covid time and the March 2022 peak of the Russia-Ukraine war. This retracement, as shown, is emerging into a double zigzag pattern - labeled W-X-Y (circled in blue) of the primary degree. Price is currently in the last leg - blue wave Y, which is also subdivided into (A)-(B)-(C) zigzag structure of the intermediate degree.
A closer look shows wave (B) is ongoing and has completed a double zigzag. However, one more rally is likely to surface for a triple zigzag. So, we are torn between a double and triple zigzag for (B). One has to be invalidated for the other to be valid. If it’s a double zigzag, the current decline from Y should break the channel downwards and complete an impulse. However, if the current dip completes another corrective structure and price responds sharply upside, a triple zigzag will be favored. Therefore, we need to investigate the current dip on the H4 chart.
The H4 chart shows a double zigzag emerging from wave Y. The commodity should find support between the 79.23 and 76.90 Fibonacci areas and react sharply upside for wave Z to complete a triple zigzag. This is the preferred count. However, if a significant rebound doesn’t happen at the zone and the decline continues below 75.49, we can refer to the drop from Y as an impulse and take wave (B) to have ended at 87.63 with a double zigzag structure.
Crude Oil Elliott Wave technical analysis [Video]
Author

Peter Mathers
TradingLounge
Peter Mathers started actively trading in 1982. He began his career at Hoei and Shoin, a Japanese futures trading company.


