CPI vs. PCE Price Index – Which is a better measure of inflation in US?
- Fed prefers PCE Price Index over CPI when adjusting policy for inflation.
- CPI is watched closely by households and gets more press than PCE Price Index.
- PCE Price Index reflects underlying inflation trend more accurately than CPI.

Inflation in the US, as measured by the Consumer Price Index (CPI), is sitting at its highest level in nearly four decades and markets are concerned that the US Federal Reserve’s aggressive tightening to battle inflation could weigh on economic activity.
When the Fed conducts its monetary policy, it uses the Personal Consumer Price (PCE) Index, also known as PCE deflator, as its preferred gauge of inflation. More specifically, the Fed looks at the annual Core PCE Price Index, which excludes volatile food and energy prices. Why is it that CPI garners wider media coverage and triggers a more significant market reaction than PCE Price Index when it’s not even the Fed’s primary measure of inflation? In this article, we will try to answer this question by explaining the differences between these two data releases and looking at their market implications.
CPI vs PCE Price Index
CPI and PCE inflation figures are both calculated by measuring the changes in the prices of a set basket of goods and services. There are, however, differences in the way these baskets are composed.
CPI is produced by the US Bureau of Labor Statistics (BLS) and is derived from the Consumer Expenditure Surveys while PCE Price Index is derived from the Personal Consumption Expenditures of the US Bureau of Economic Analysis’ National Income and Product Accounts (NIPA) tables.
CPI intends to measure the change in prices that consumers pay directly. On the other hand, PCE Price Index is designed to track the changes in prices businesses charge for certain goods and services. Since businesses’ pricing strategies vary from consumers’ spending patterns, these two indexes put differing weights on prices. This is commonly referred to as the “weight effect.”
CPI only covers so-called “out-of-pocket expenditures.” PCE Price Index includes indirect expenditures to consumers, such as medical care paid by employer-provided insurance. This is known as the “scope effect.” Moreover, PCE includes rural-urban and non-profit spending whereas CPI only looks at urban spending.
Finally, these indexes handle the variations in the baskets differently. PCE Price Index aims to account for changes in spending decisions. For example, if a sharp increase in the price of beef causes consumers to spend less on beef and more on pork, the basket that PCE Price Index uses is revised to reflect that whereas CPI’s basket is left (largely) unchanged.
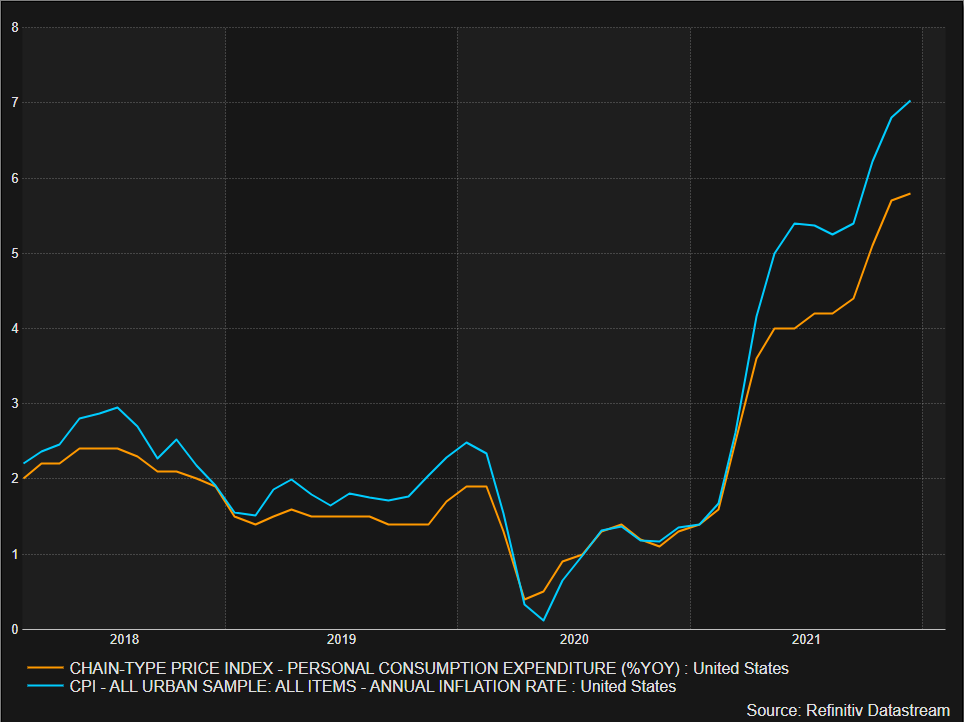
The chart below shows how CPI and the PCE Price Index compare from 2018 to end-2021.
Why does CPI get more attention than the PCE Price Index?
CPI shows how consumers are impacted by rising prices in the short term better than the PCE Price Index since it’s sourced from a consumer survey. When wage inflation is lower than CPI inflation it points to a squeeze on real incomes, which could result in weakening consumer confidence and spending intentions.
CPI is used as the reference inflation rate on real yields, or the yield on a Treasury Inflation Protected Securities (TIPS) bond, and some derivative contracts, such as inflation swaps.
CPI is also used for the Cost-of-Living Adjustment (COLA) on the Social Security and Supplemental Security Income (SSI) benefits for approximately 70 million Americans. Back in October, the Social Security Administration announced that benefit payments would increase by 5.9% in 2022.
Why does the Fed prefer the PCE Price Index over CPI?
The PCE Price Index is a broader measure of inflation since it takes indirect payments, rural-urban and non-profit spending into consideration. It is also less volatile than CPI because it is adjusted to factor in changes in consumer behavior.
The underlying inflation trend is more important for the Fed when it needs to adjust its policy and the PCE Price Index paints a more accurate picture than CPI because of the factors mentioned above.
Market implications
Since CPI is the more volatile inflation reading, there is a higher chance of it surprising markets and triggering a significant market reaction.
For the previous 20 CPI prints, the average deviation, which measures the surprise caused when the actual data differs from the consensus, on the FXStreet calendar was 0.77. It was only 0.22 for the PCE Price Index.
Additionally, CPI for a given month is published before the PCE Price Index. CPI data for December-2021 was published on January 12, two weeks before PCE.
Author

Eren Sengezer
FXStreet
As an economist at heart, Eren Sengezer specializes in the assessment of the short-term and long-term impacts of macroeconomic data, central bank policies and political developments on financial assets.


