CPI doesn’t move markets

US Dollar: Jun '23 USD is Down at 100.965.
Energies: May '23 Crude is Down at 83.12.
Financials: The Jun '23 30 Year T-Bond is Up 1 tick and trading at 132.06.
Indices: The Jun '23 S&P 500 emini ES contract is 35 ticks Higher and trading at 4126.00.
Gold: The Jun'23 Gold contract is trading Up at 2041.10. Gold is 163 ticks Higher than its close.
Initial conclusion
This is not a correlated market. The USD is Down, and Crude is Down which is not normal, but the 30 Year T-Bond is trading Higher. The Financials should always correlate with the US dollar such that if the dollar is Higher, then the bonds should follow and vice-versa. The S&P is Higher, and Crude is trading Lower which is correlated. Gold is trading Higher which is correlated with the US dollar trading Down. I tend to believe that Gold has an inverse relationship with the US Dollar as when the US Dollar is down, Gold tends to rise in value and vice-versa. Think of it as a seesaw, when one is up the other should be down. I point this out to you to make you aware that when we don't have a correlated market, it means something is wrong. As traders you need to be aware of this and proceed with your eyes wide open. At the present time Asia is trading Higher with the exception of the Shanghai exchange which is Lower. All of Europe is trading Lower with the exception of the Paris exchange which is Higher.
Possible challenges to traders today
-
PPI m/m is out at 8:30 AM EST. This is Major.
-
Core PPI m/m is out at 8:30 AM EST. This is Major.
-
Unemployment Claims are out at 8:30 AM EST. This is Major.
-
Natural Gas Storage is out at 10:30 AM EST. This is Major.
-
30-y Bond Auction starts at 1 PM EST. Major.
Treasuries
Traders, please note that we've changed the Bond instrument from the 30 year (ZB) to the 10 year (ZN). They work exactly the same.
We've elected to switch gears a bit and show correlation between the 10-year bond (ZN) and the S&P futures contract. The S&P contract is the Standard and Poor's, and the purpose is to show reverse correlation between the two instruments. Remember it's likened to a seesaw, when up goes up the other should go down and vice versa.
Yesterday the ZN migrated Higher at around 8:30 AM EST but at the same time the S&P hit a High. If you look at the charts below the ZN gave a signal at around 8:30 AM and the ZN continued its Upward trend. Look at the charts below and you'll see a pattern for both assets. S&P hit a High at around 8:30 AM and migrated Lower. These charts represent the newest version of MultiCharts and I've changed the timeframe to a 15-minute chart to display better. This represented a Long opportunity on the 10-year note, as a trader you could have netted about 30 ticks per contract on this trade. Each tick is worth $15.625. Please note: the front month for the ZN is now Jun '23. The S&P contract is also Jun' 23. I've changed the format to filled Candlesticks (not hollow) such that it may be more apparent and visible.
Charts courtesy of MultiCharts built on an AMP platform
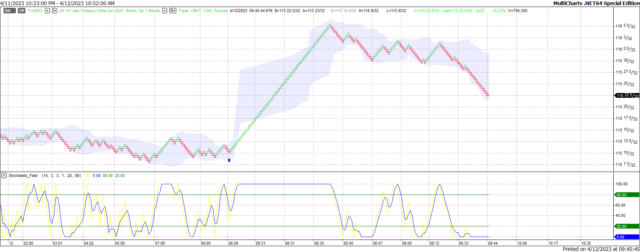
ZN - Jun 2023 - 4/12/23
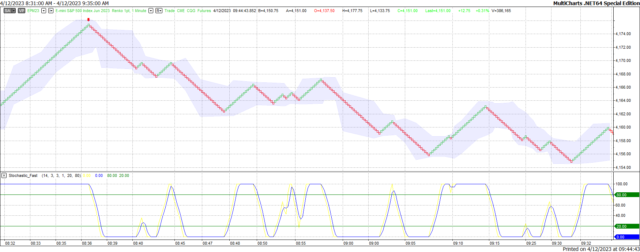
S&P - Jun 2023 - 4/12/23
Bias
Yesterday we gave the markets an Upside bias as both the USD and the Bonds were trading Lower Wednesday morning and that usually reflects an Upside Day. The markets however had other ideas as the Dow dropped 38 points and the other indices lost ground as well. Today we aren't dealing with a correlated market and our bias is Neutral.
Could this change? Of Course. Remember anything can happen in a volatile market.
Commentary
So yesterday we had a major economic report in the guise of CPI and it turns out that CPI (and inflation for that matter) is starting to fall. CPI dropped a full percentage point from 6% down to 5% for the month of March 2023. This is good news to anyone and the markets took off on that news. The irony here is that the markets were in positive territory most of the trading session and dropped around 3 PM EST, so the last hour of trading it appears traders were anxious and wanted to take money off the table, so to speak. Today we have PPI numbers that reflect Producer Price Index which is money producers have to pay for raw materials and supplies needed to produce product. We also have Unemployment Claims which is major and a proven market mover. Will this be enough to set the markets on the proper direction? Only time will tell.
Author

Nick Mastrandrea
Market Tea Leaves


