USD: Sep '23 is Down at 99.955.

Energies: Aug '23 Crude is Down at 75.74.

Financials: The Sep '23 30 Year T-Bond is Up 11 ticks and trading at 126.04.

Indices: The Sep '23 S&P 500 emini ES contract is 44 ticks Higher and trading at 4518.50. 

Gold: The Aug'23 Gold contract is trading Up at 1964.90. Gold is 28 ticks Higher than its close.

Initial conclusion

This is not a correlated market.  The USD is Down and Crude is Down fractionally which is not normal, but the 30 Year T-Bond is trading Higher. The Financials should always correlate with the US dollar such that if the dollar is Higher, then the bonds should follow and vice-versa. The S&P is Higher, and Crude is trading Lower which is correlated. Gold is trading Higher which is correlated with the US dollar trading Down. I tend to believe that Gold has an inverse relationship with the US Dollar as when the US Dollar is down, Gold tends to rise in value and vice-versa. Think of it as a seesaw, when one is up the other should be down. I point this out to you to make you aware that when we don't have a correlated market, it means something is wrong. As traders you need to be aware of this and proceed with your eyes wide open. At the present time all of Asia is trading Higher. Currently all of Europe is trading Higher as well.

Possible challenges to traders

  • PPI m/m is out at 830 AM EST. This is Major.

  • Core PPI m/m is out at 8:30 AM EST. This is Major.

  • Unemployment Claims are out at 8:30 AM EST. This is Major.

  • Natural Gas Storage is out at 10:30 AM EST. This is Major.

  • 30-y Bond Auction starts at 1 PM EST. This is Major.

  • Federal Budget Balance is out at 2 PM EST. This is Major.

  • FOMC Member Waller Speaks at 6:45 PM EST. This is not Major.

Treasuries

Traders, please note that we've changed the Bond instrument from the 30 year (ZB) to the 10 year (ZN).  They work exactly the same.  

We've elected to switch gears a bit and show correlation between the 10-year bond (ZN) and the S&P futures contract. The S&P contract is the Standard and Poor's, and the purpose is to show reverse correlation between the two instruments. Remember it's likened to a seesaw, when up goes up the other should go down and vice versa.

Yesterday the ZN migrated Higher at around 10:45 AM EST as the S&P fell around the same time. If you look at the charts below the S&P gave a signal at around 10:45 AM and the ZN started its Upward climb. Look at the charts below and you'll see a pattern for both assets. S&P hit a High at around 10:45 AM and migrated Lower. These charts represent the newest version of MultiCharts and I've changed the timeframe to a 15-minute chart to display better. This represented a Long opportunity on the 10-year note, as a trader you could have netted about 20 ticks per contract on this trade. Each tick is worth $15.625. Please note: the front month for the ZN is now Sept '23. The S&P contract is now Sep' 23. I've changed the format to filled Candlesticks (not hollow) such that it may be more apparent and visible.  

Charts courtesy of MultiCharts built on an AMP platform 

Chart

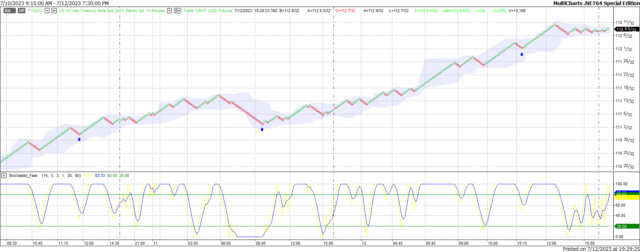
ZN - Sept 2023 - 7/12/23

Chart

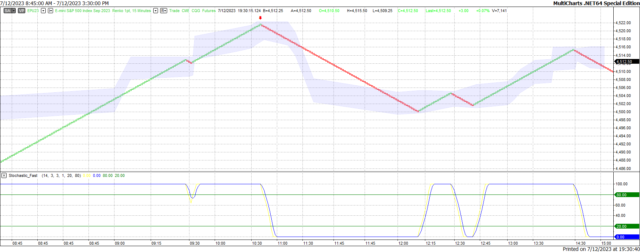
S&P - Sep 2023 - 7/12/23

Bias

Yesterday we gave the markets an Upside bias as the USD was trading Lower and the S&P was Higher Wednesday morning. The markets didn't disappoint as the Dow closed Higher by 86 points and the other indices closed Higher as well. Today we aren't dealing with a correlated market and our bias is to the Upside.

Could this change? Of Course. Remember anything can happen in a volatile market. 

Commentary

So, yesterday the markets continued its upward climb with all indices trading and closing Higher. The CPI numbers came in better than expected and this served to boost the markets Higher as the perception is that the Fed won't hike if they see tame CPI numbers. That is only one half of the equation.  Today we have PPI numbers which is what producers and manufacturers pay for raw materials and components used in making various manufactured products. Think of it as CPI for producers. These numbers come out at 8:30 AM EST.  Will this propel the markets Higher? Only time will tell...

Trading performance displayed herein is hypothetical. The following Commodity Futures Trading Commission (CFTC) disclaimer should be noted.

Hypothetical performance results have many inherent limitations, some of which are described below. No representation is being made that any account will or is likely to achieve profits or losses similar to those shown.

In fact, there are frequently sharp differences between hypothetical performance results and the actual results subsequently achieved by any particular trading program. One of the limitations of hypothetical performance trading results is that they are generally prepared with the benefit of hindsight.

In addition, hypothetical trading does not involve financial risk, and no hypothetical trading record can completely account for the impact of financial risk in actual trading. For example, the ability to withstand losses or to adhere to a particular trading program in spite of trading losses are material points which can also adversely affect actual trading results.

There are numerous other factors related to the markets in general or to the implementation of any specific trading program which cannot be fully accounted for in the preparation of hypothetical performance results and all of which can adversely affect actual trading results.

Trading in the commodities markets involves substantial risk and YOU CAN LOSE A LOT OF MONEY, and thus is not appropriate for everyone. You should carefully consider your financial condition before trading in these markets, and only risk capital should be used.

In addition, these markets are often liquid, making it difficult to execute orders at desired prices. Also, during periods of extreme volatility, trading in these markets may be halted due to so-called “circuit breakers” put in place by the CME to alleviate such volatility. In the event of a trading halt, it may be difficult or impossible to exit a losing position.

Recommended Content


Recommended Content

Editors’ Picks

EUR/USD eases to 1.1050 amid cautious markets

EUR/USD eases to 1.1050 amid cautious markets

EUR/USD turns south toward 1.1050 on Wednesday's European morning. The pair remains undermined by sustained US Dollar strength, in the face of the Middle East conflict and pre-ADP data nervousness. Speeches from ECB and Fed policymakers will be also eyed. 

EUR/USD News
GBP/USD stays pressured toward 1.3250 on tepid risk sentiment

GBP/USD stays pressured toward 1.3250 on tepid risk sentiment

GBP/USD remains pressured toward 1.3250 early Wednesday, following the previous decline. This downside could be attributed to risk aversion due to the rising geopolitical tensions in the Middle East, which underpins the safe-haven US Dollar at the expense of the risk-sensitive Pound Sterling. 

GBP/USD News
Gold price edges lower on firmer US Dollar, geopolitical risks might cap its downside

Gold price edges lower on firmer US Dollar, geopolitical risks might cap its downside

Gold price ticks lower during the early European session on Wednesday and erodes a part of the previous day's strong gains of over 1%, triggered by a further escalation of geopolitical tensions in the Middle East.

Gold News
Are we in for a Bitcoin and crypto market Uptober? Let's observe the key factors

Are we in for a Bitcoin and crypto market Uptober? Let's observe the key factors

Bitcoin and the crypto market may rally in the coming days as “Uptober” is trending across several crypto community platforms on Tuesday. However, a few key market factors could alter or strengthen the bullish bias among investors.

Read more
RBA widely expected to keep key interest rate unchanged amid persisting price pressures

RBA widely expected to keep key interest rate unchanged amid persisting price pressures

The Reserve Bank of Australia is likely to continue bucking the trend adopted by major central banks of the dovish policy pivot, opting to maintain the policy for the seventh consecutive meeting on Tuesday.

Read more
Five best Forex brokers in 2024

Five best Forex brokers in 2024

VERIFIED Choosing the best Forex broker in 2024 requires careful consideration of certain essential factors. With the wide array of options available, it is crucial to find a broker that aligns with your trading style, experience level, and financial goals. 

Read More

Majors

Cryptocurrencies

Signatures